Theory question 202
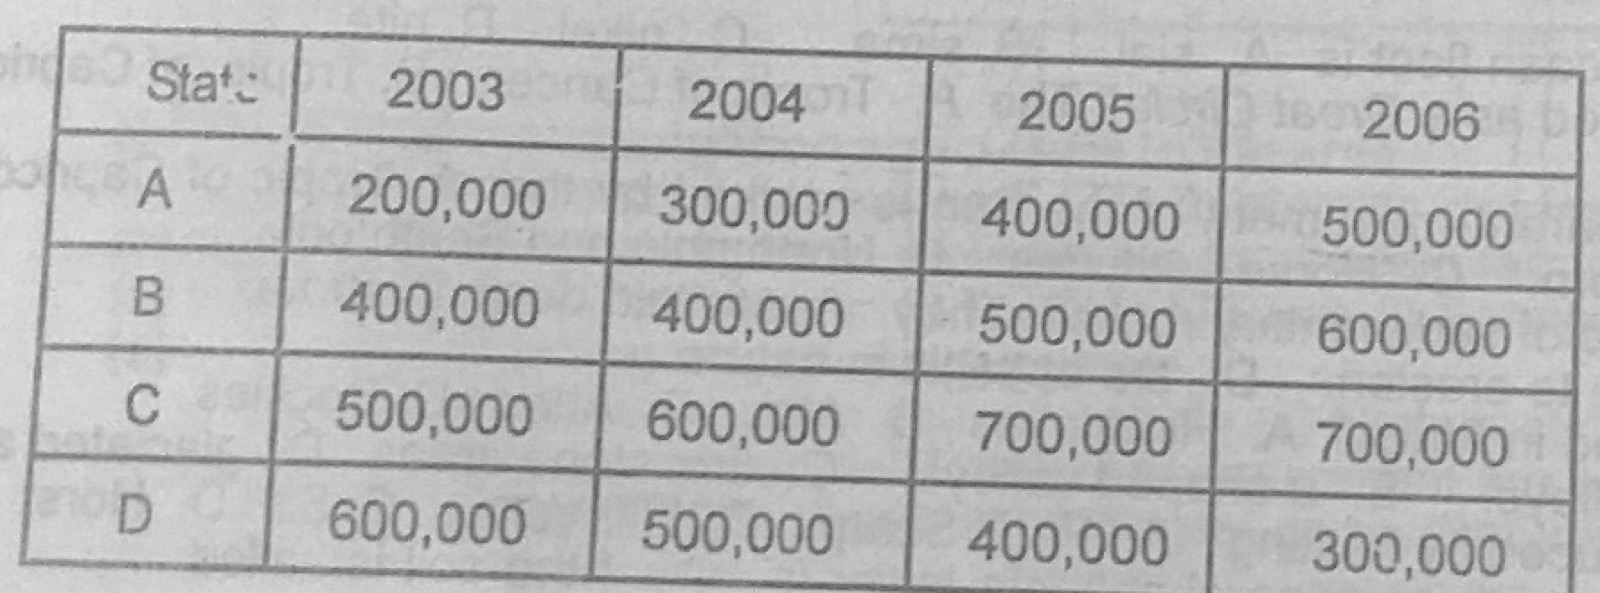
Statistical Maps and DiagramsThe table below shows the quantity of yams in kilogrammes produced by four yam producing states in country X between 2003 and 2006.
State A: 2003 200,000; 2004 300,000; 2005 400,000; 2006 500,000
State B: 2003 400,000; 2004 400,000; 2005 500,000; 2006 600,000
State C: 2003 500,000; 2004 600,000; 2005 700,000; 2006 700,000
State D: 2003 600,000; 2004 500,000; 2005 400,000; 2006 300,000
(a) Draw a comparative / group bar graph to represent the statistics. (b) State two advantages of using comparative / group bar graphs in showing statistics. (c) Name one other method that can be used in showing the statistics.
Show the model answer
(a) Title; vertical axis 'Quantity (kg)' with a suitable scale (e.g. 1 cm = 100,000 kg) from 0 to 700,000; horizontal axis with the four states; for each state four touching bars (2003, 2004, 2005, 2006) of correct heights, shaded differently; key to the shading; gaps between groups.
(b) Easy to compare years and states at a glance; easy to draw and read; shows trends (A, B, C rising, D falling); actual values can be read off; attractive.
(c) Divided (compound) bar graph; line graph; pie charts; proportional circles; table.
Keep the same shading for each year in every group.