Question 22
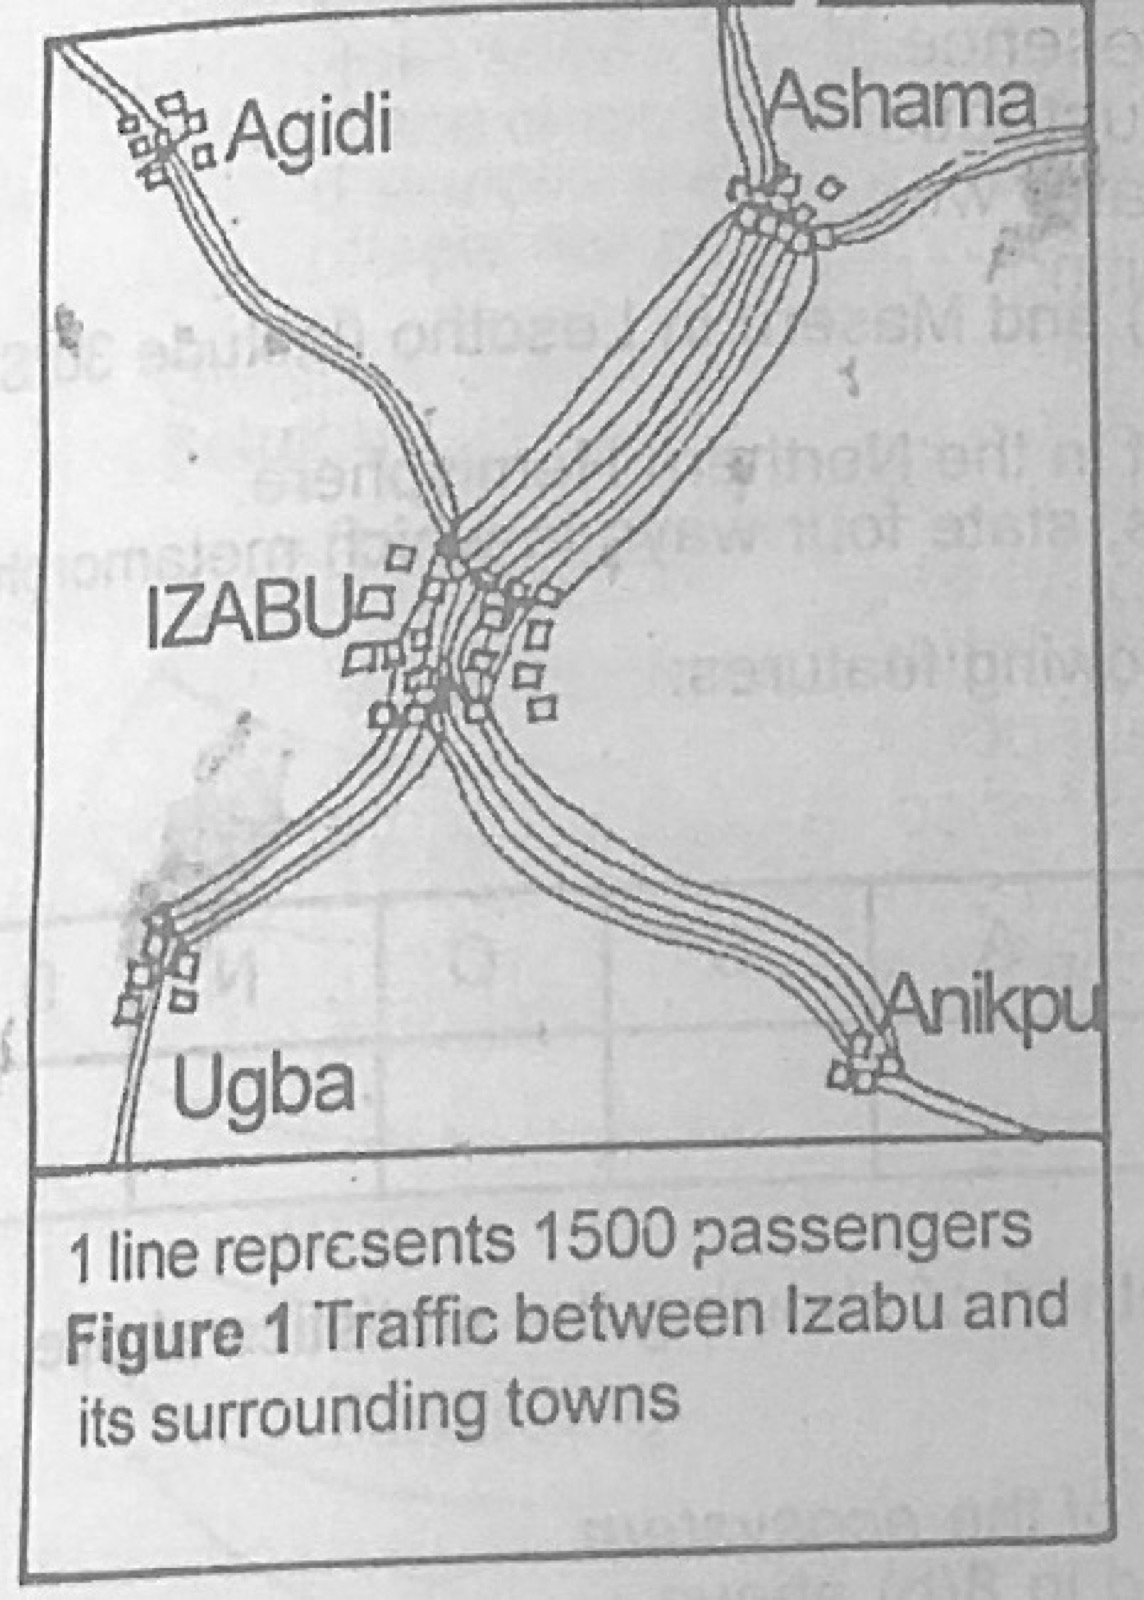
Statistical Maps and DiagramsUse Figure 1 (Traffic between Izabu and its surrounding towns; 1 line represents 1500 passengers) to answer this question. Figure 1 above represents a
- A.pie chart.
- B.flow line map.
- C.dot map.
- D.simple graph.
Show the answer and explanation
Answer: B (flow line map.)
Explanation
Bands of lines whose number shows the volume of traffic along routes form a flow line map.