Question 19
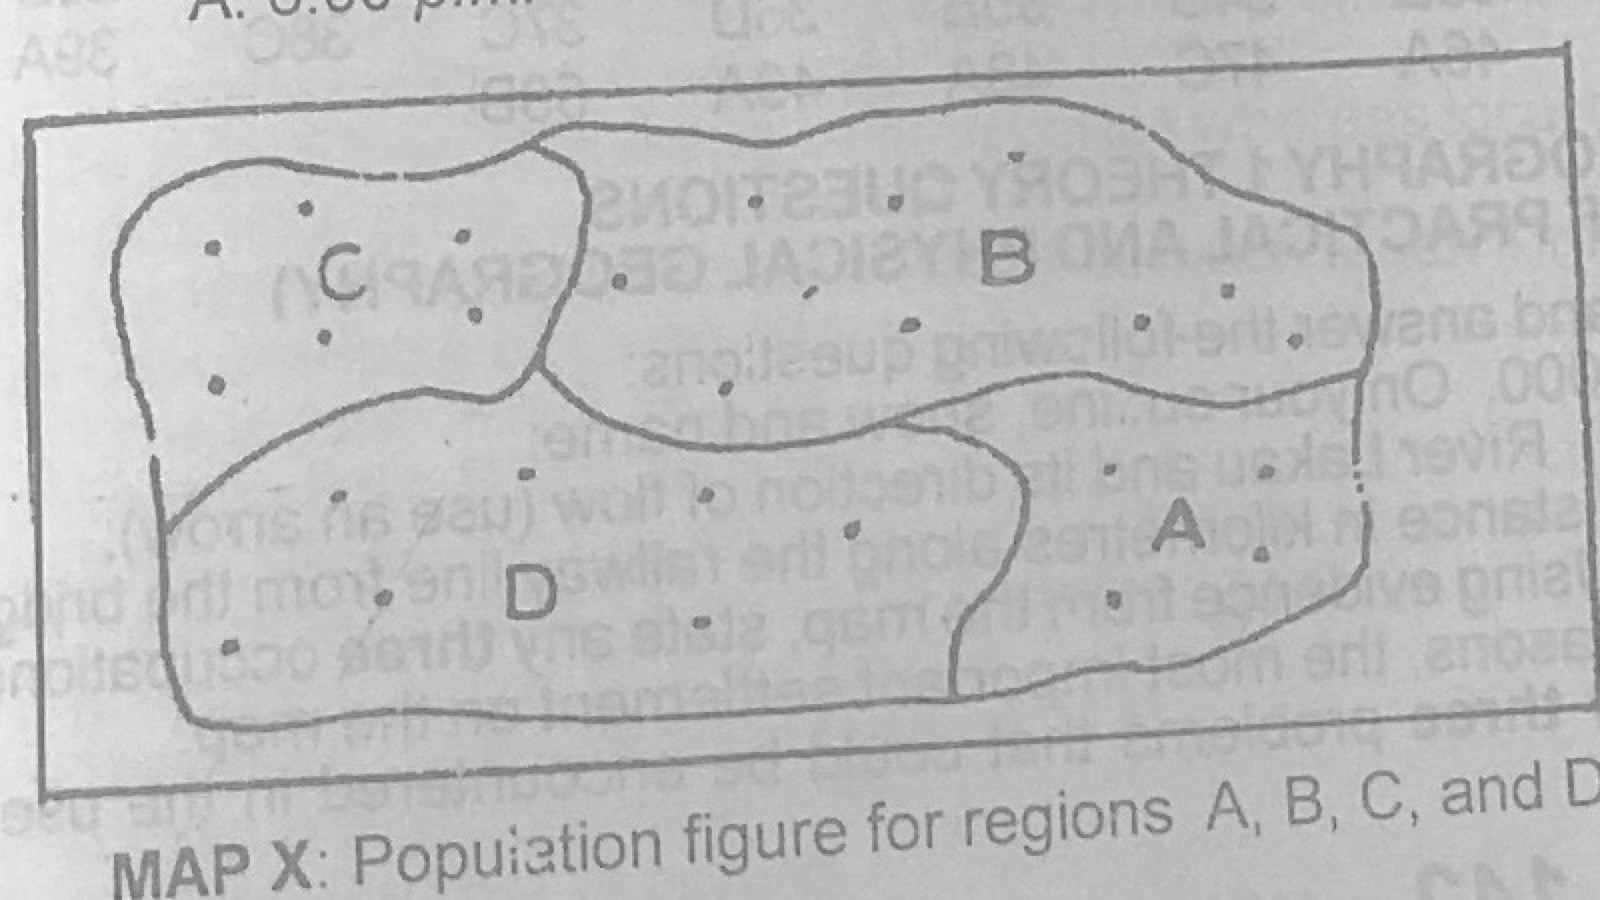
Statistical Maps and DiagramsMap X shows the population of regions A, B, C and D (1 dot represents 10,000 persons). Use it to answer this question. What type of statistical method was used to represent the population in map X above?
- A.Histogram
- B.Pie chart
- C.Proportional circle
- D.Dot map.
Show the answer and explanation
Answer: D (Dot map.)
Explanation
Each dot stands for a fixed number of people, so it is a dot map.