Theory question 202
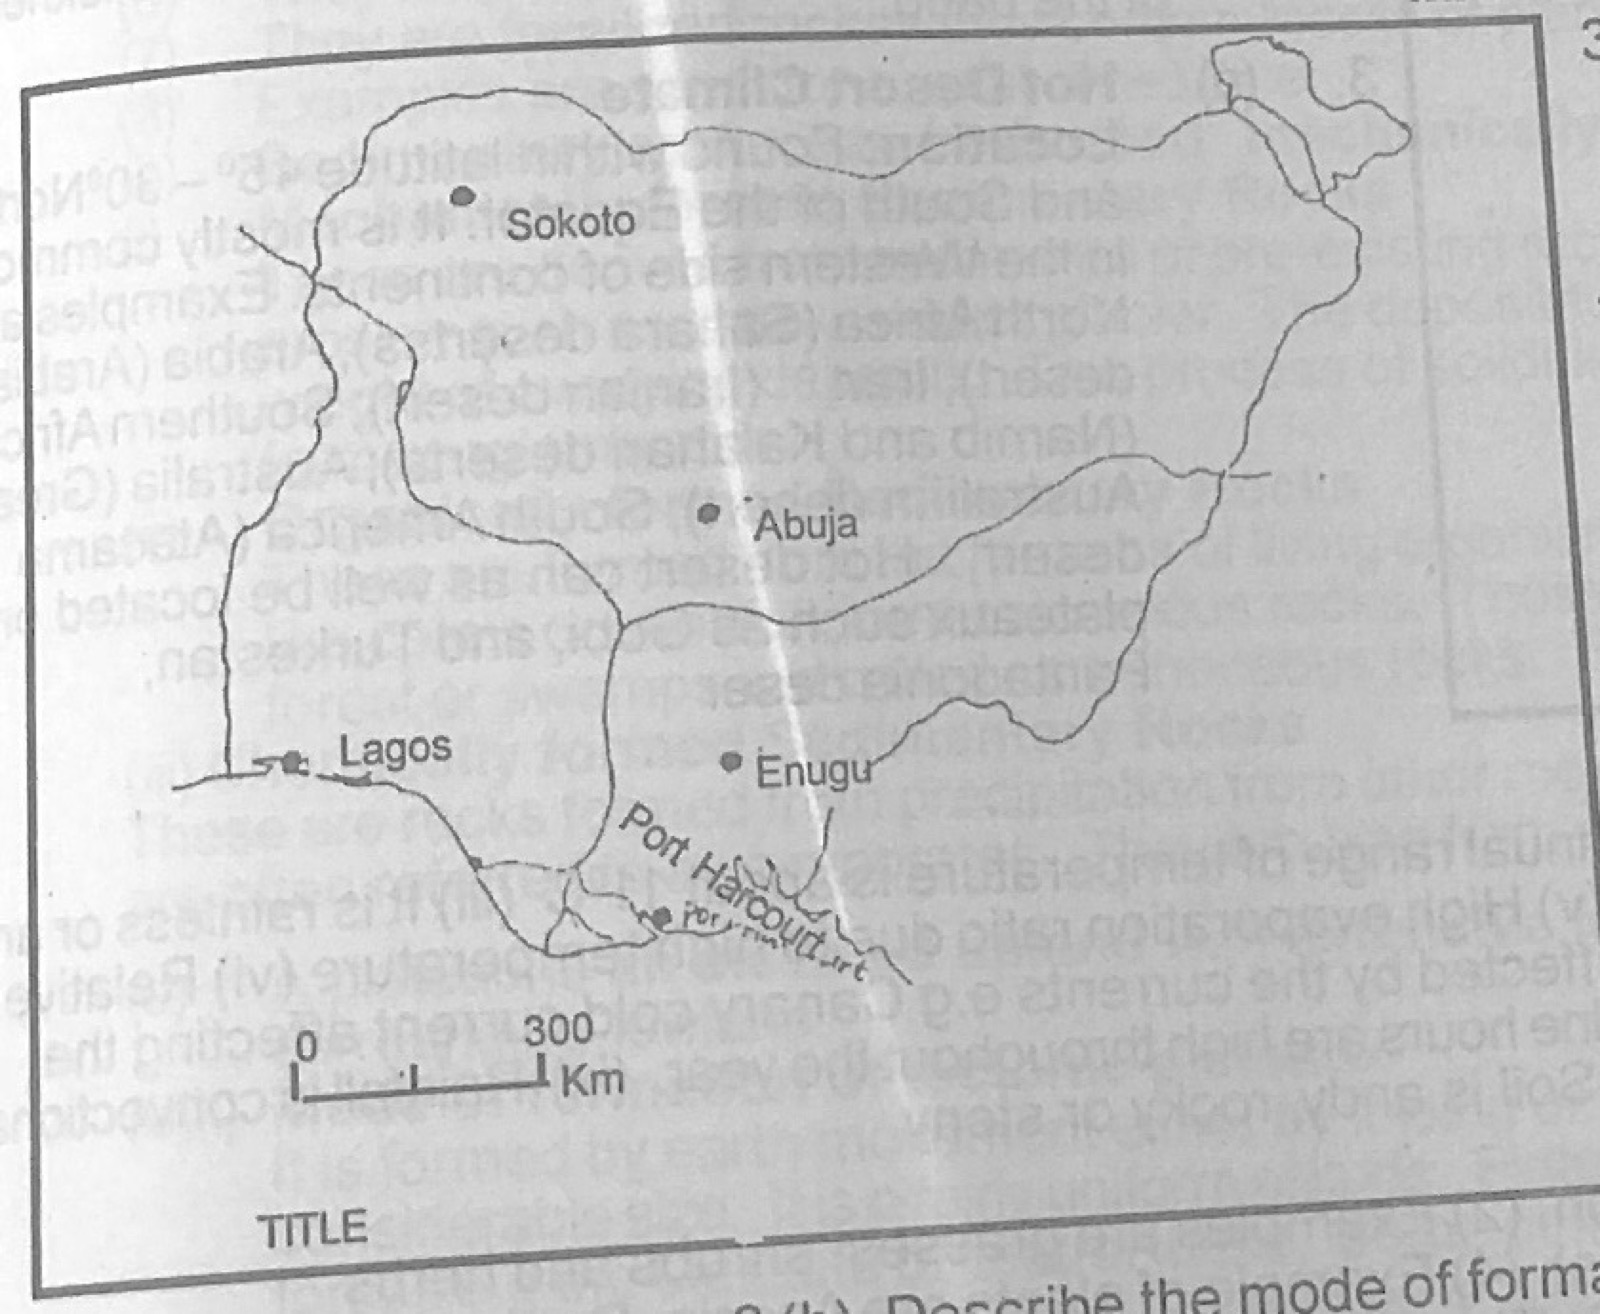
Statistical Maps and DiagramsThe Table 1 below shows the volume of air passenger traffic between Lagos and four other cities in Nigeria in 1985. Study the table and use the data in it to answer the questions that follow:
Table 1 – Volume of air passenger traffic between Lagos and four other cities in Nigeria, 1985
1. Lagos – Abuja: 500,000
2. Lagos – Enugu: 200,000
3. Lagos – Port Harcourt: 400,000
4. Lagos – Sokoto: 300,000
(a) Using the attached map of Nigeria — Map B, construct a flow map/chart to represent the data in Table 1. (b) State two advantages of representing data with flow maps.
Show the model answer
(a) Choose a scale for band width, e.g. 1 mm = 50,000 passengers (or 1 cm = 200,000): Abuja 10 mm (2.5 cm), Port Harcourt 8 mm (2.0 cm), Sokoto 6 mm (1.5 cm), Enugu 4 mm (1.0 cm); draw a band from Lagos to each city along the route, its width proportional to the passengers; add title, key/width scale, north arrow.
(b) Shows both the direction (route) and volume of movement at a glance; makes comparison of routes easy; gives a clear visual impression; shows the location of places linked.
Make band width proportional to the number of passengers and give the width scale.