Question 11
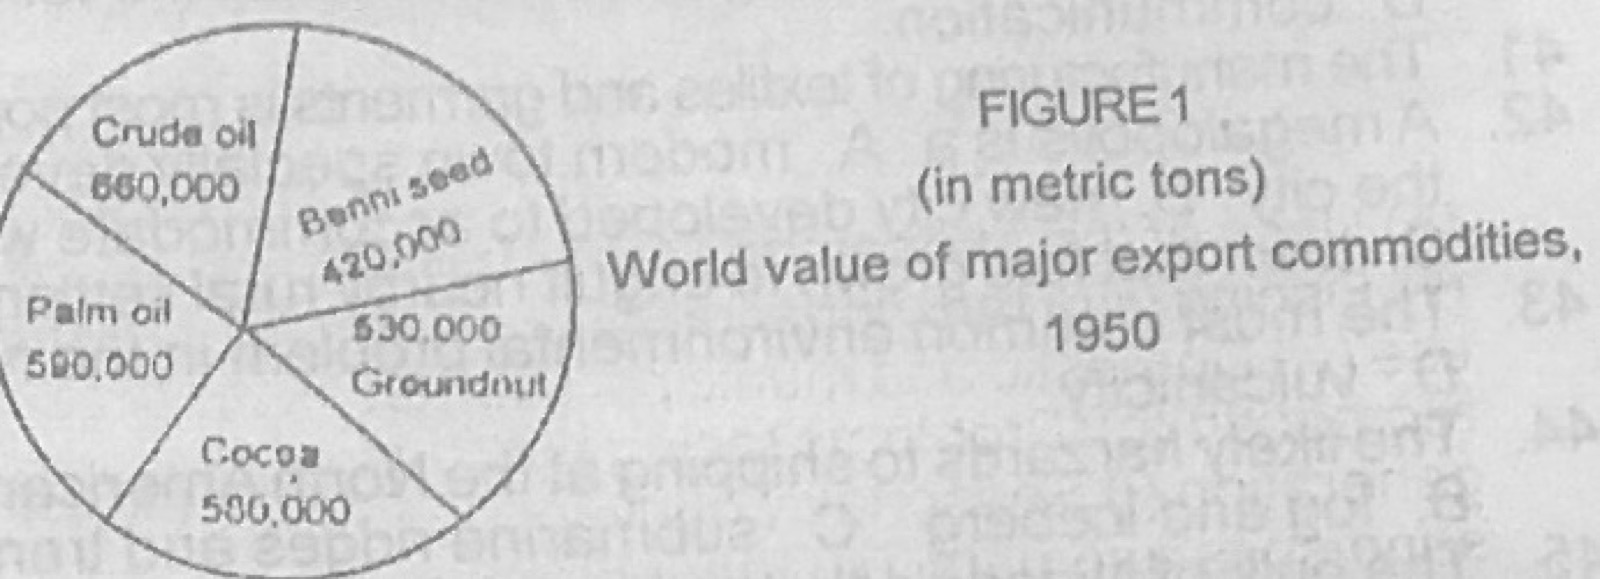
Statistical Maps and DiagramsUse Figure 1 (world value of major export commodities, 1950, in metric tons: crude oil 660,000; benni seed 420,000; groundnut 530,000; cocoa 580,000; palm oil 590,000) to answer this question. The figure 1 is a
- A.wind rose
- B.pie chart
- C.proportional circle
- D.divided proportional circle
Show the answer and explanation
Answer: B (pie chart)
Explanation
A single circle divided into sectors in proportion to each value is a pie chart.