Theory question 101
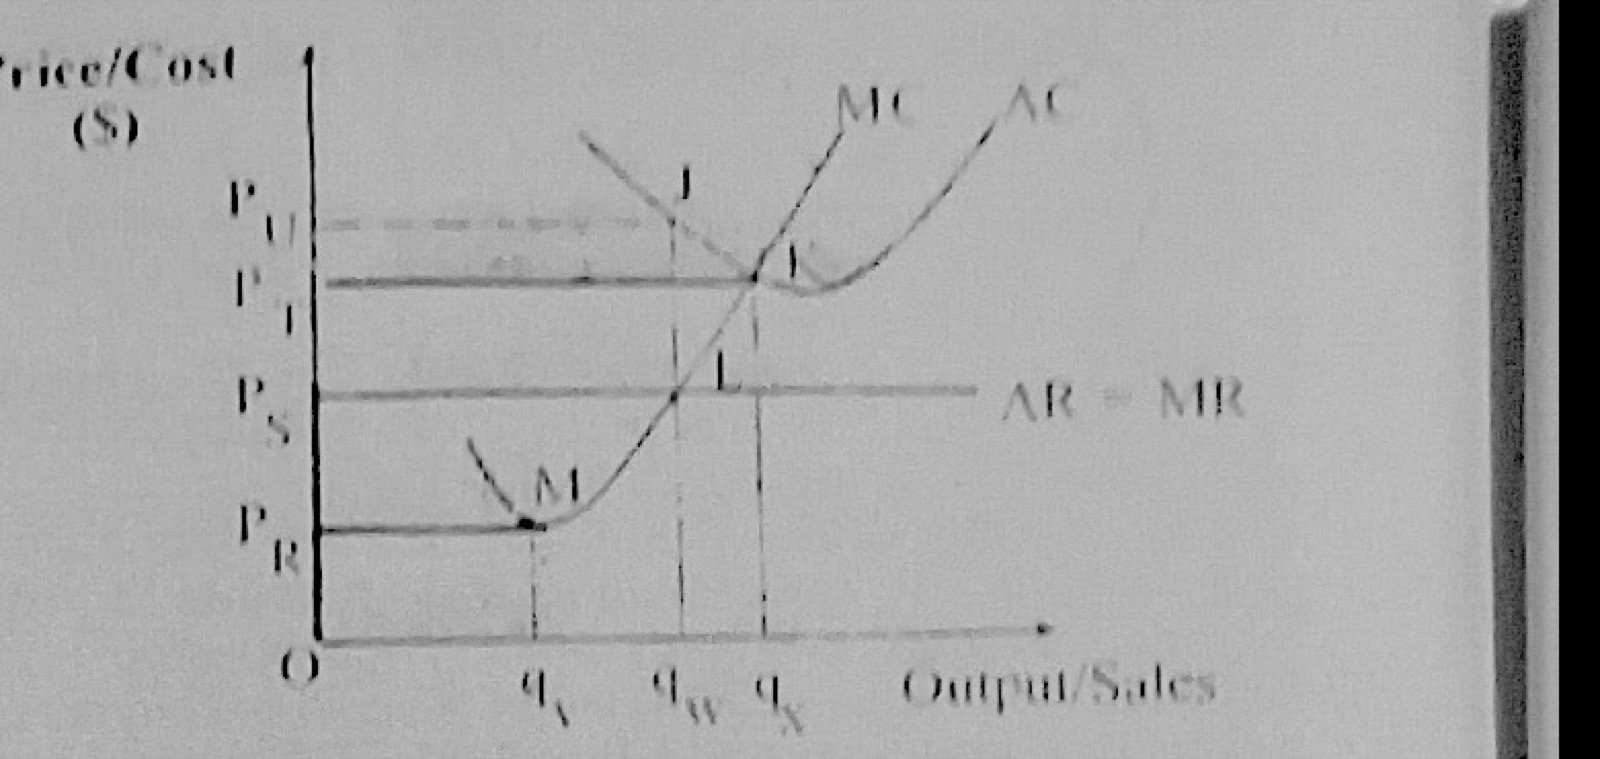
Market StructuresFigure 1 below shows the output, cost and revenue position of a business producing tissue paper. Study the diagram and answer the questions that follow.
(a) Determine the firm's equilibrium price and output.
(b) Which of the curves represents the market's demand curve?
(c) In what market is the firm operating? Give a reason for your answer.
(d) At the profit maximizing level of output, identify the area that represents: (i) total revenue; (ii) total cost; (iii) profit or loss.
(e) What is the implication of the profit or loss earned on the market in 1(d)(iii)?
Show the model answer
(a) Price PS; output qW (where MC = MR at L, MC rising).
(b) The AR = MR line (the firm's demand curve; horizontal at PS).
(c) Perfect competition: price is constant and P = AR = MR (the firm is a price taker).
(d)(i) TR = rectangle OPSLqW; (ii) TC = rectangle OPUJqW (AC at qW is at J); (iii) loss = rectangle PSPUJL.
(e) The firm is making a loss (price below average cost). In the short run it continues only if price covers average variable cost; in the long run, if losses continue, firms leave the industry until the remaining firms earn normal profit.
Compare AR and AC at the output where MC = MR.