Question 11
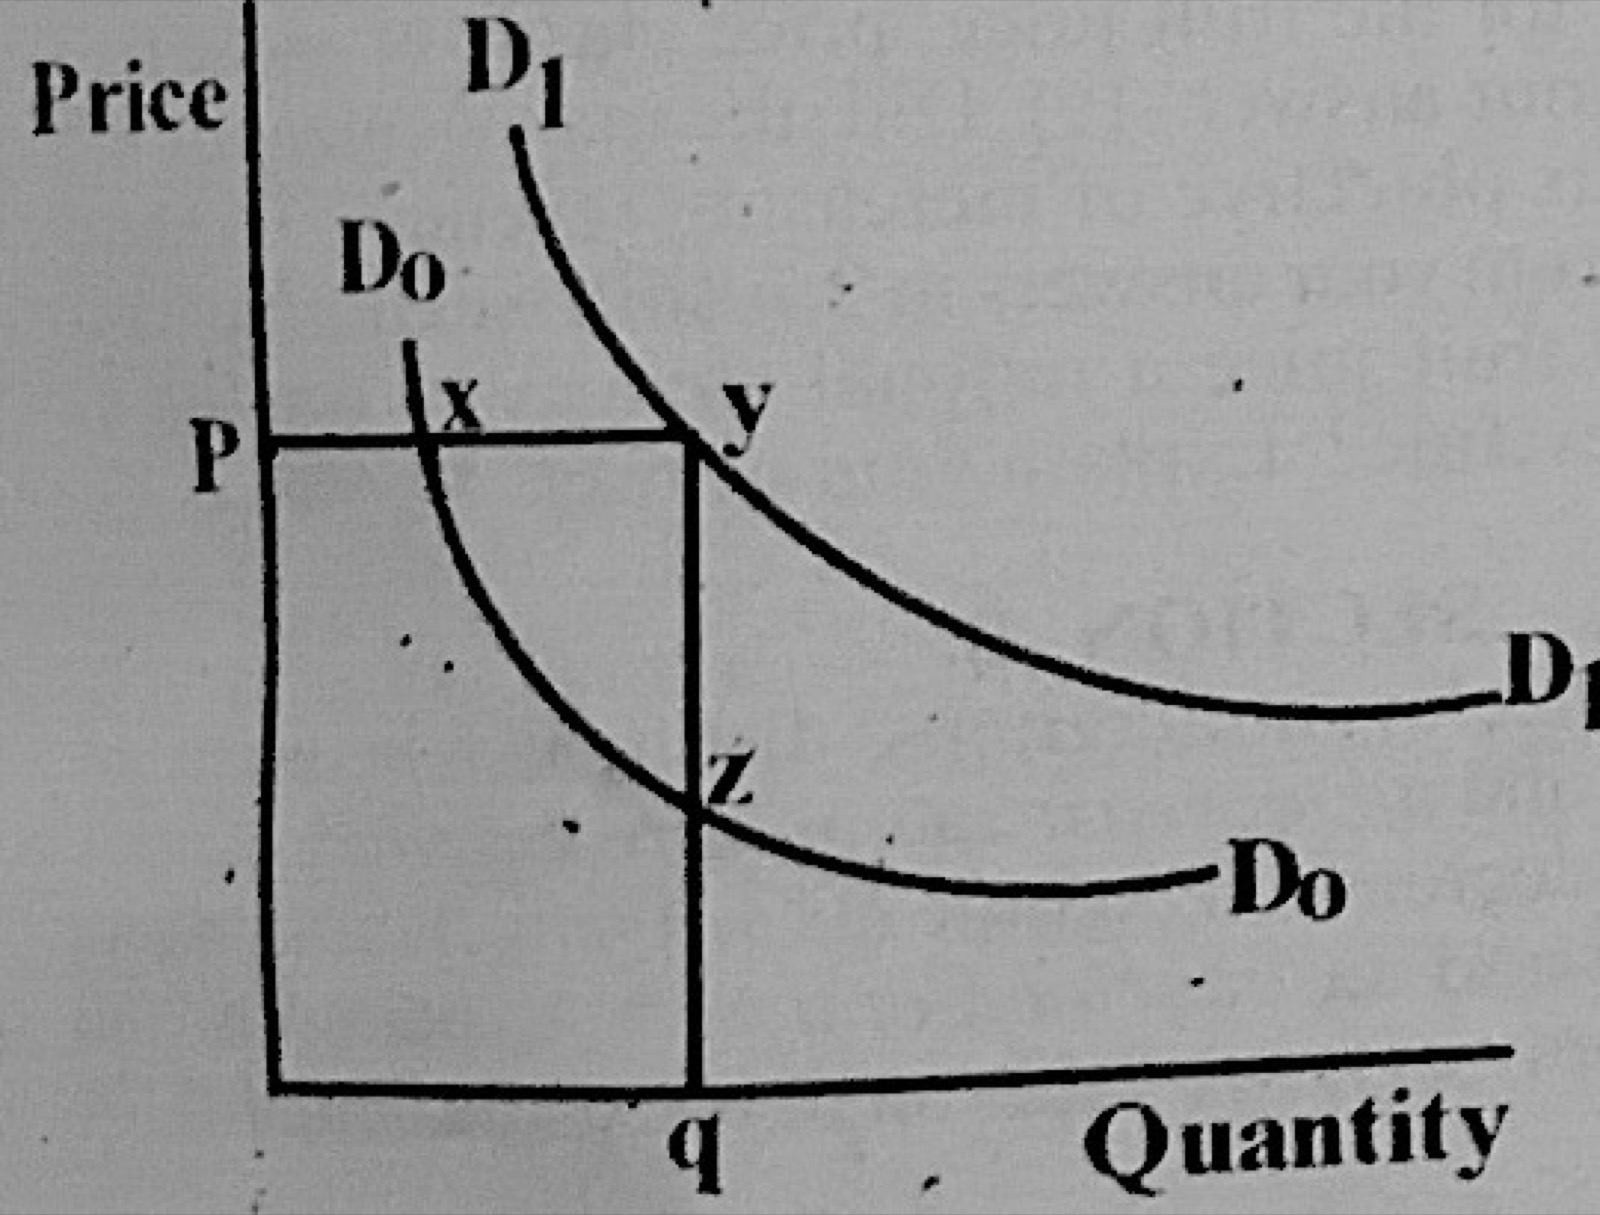
Theory of DemandThe diagram below shows the demand for milk. The movement from points x to z might have been caused by
- A.a change in taste in favour of milk.
- B.a decrease in price of milk.
- C.an increase in income of consumers.
- D.a favourable weather condition.
Show the answer and explanation
Answer: B (a decrease in price of milk.)
Explanation
x and z are on the same curve D0; moving down it to a larger quantity is caused by a fall in the price of milk.