Theory question 101
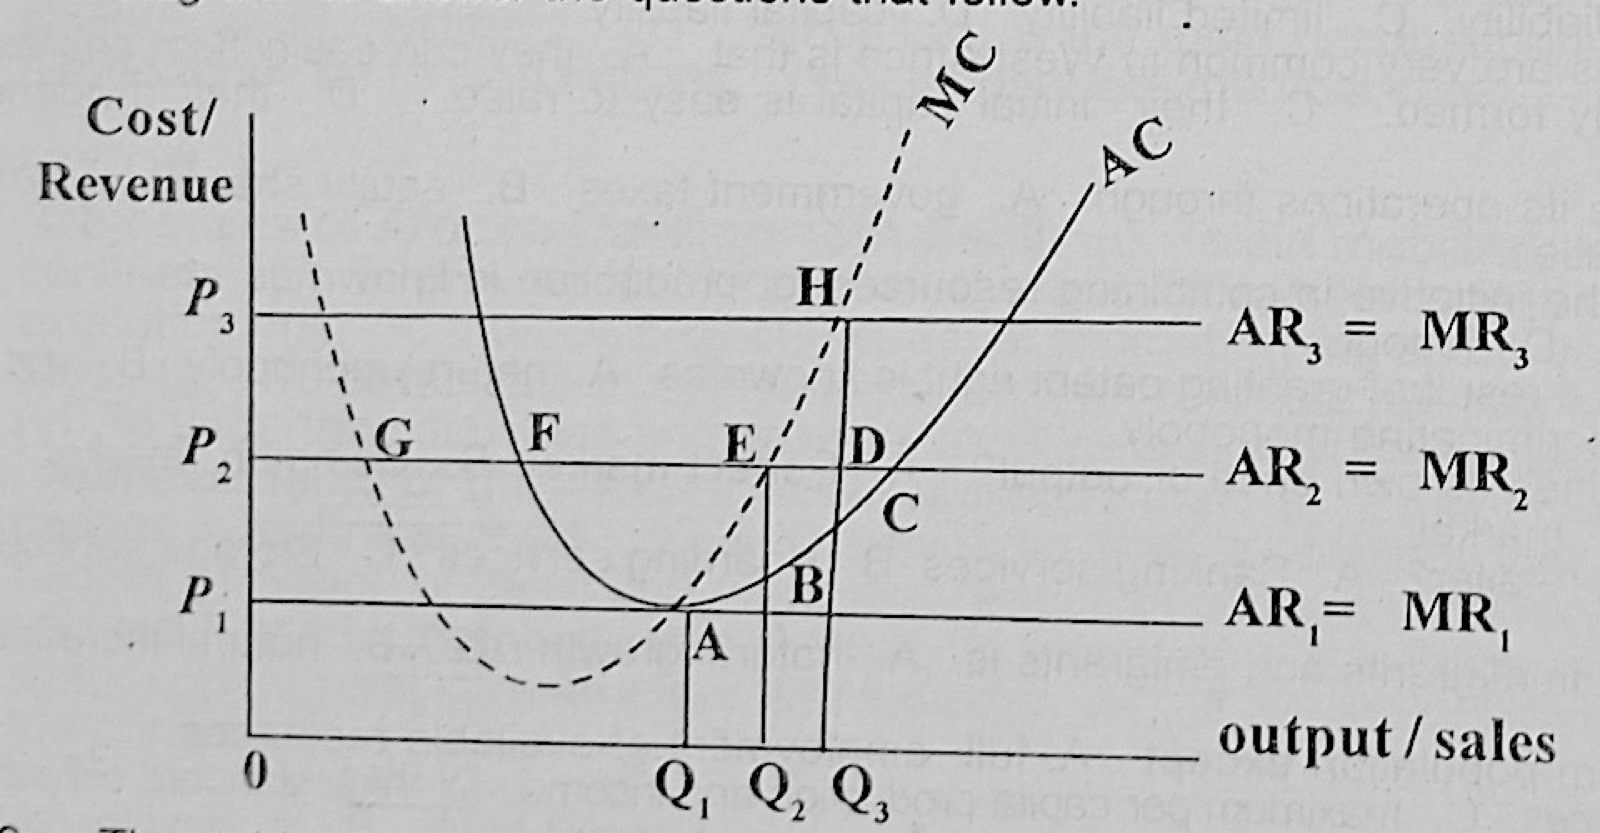
Market StructuresThe diagram below represents the cost and revenue situation of a firm. Use the information in the diagram to answer the questions that follow.
(a) Why would the firm not produce at (i) Q1; (ii) Q3?
(b) How much profit does the firm make at P2?
(c) If price falls to P1 (i) What quantity would the firm produce? (ii) What type of profit does the firm make? (iii) Explain your answer in c(ii).
(d) In which type of market is the firm operating?
Show the model answer
(a) At price P2 the profit-maximising output is Q2, where MC = MR2 (point E).
(i) At Q1, MR2 is greater than MC, so producing more units adds to profit; Q1 is not the best output.
(ii) At Q3, MC (point H) is greater than MR2, so the last units add more to cost than to revenue and reduce profit.
(b) Profit = (price − average cost) × quantity = (P2 − AC at Q2) × OQ2 = EB × OQ2, the rectangle between P2 and the AC curve above OQ2: supernormal (abnormal) profit.
(c)(i) Q1, where MC = MR1 (point A).
(ii) Normal profit only.
(iii) At Q1, AR = AC (price equals minimum average cost); normal profit is included in average cost, so there is no supernormal profit.
(d) Perfect competition (AR = MR are horizontal lines: the firm is a price taker).
Profit is maximised where MC = MR; profit is the gap between AR and AC times quantity.