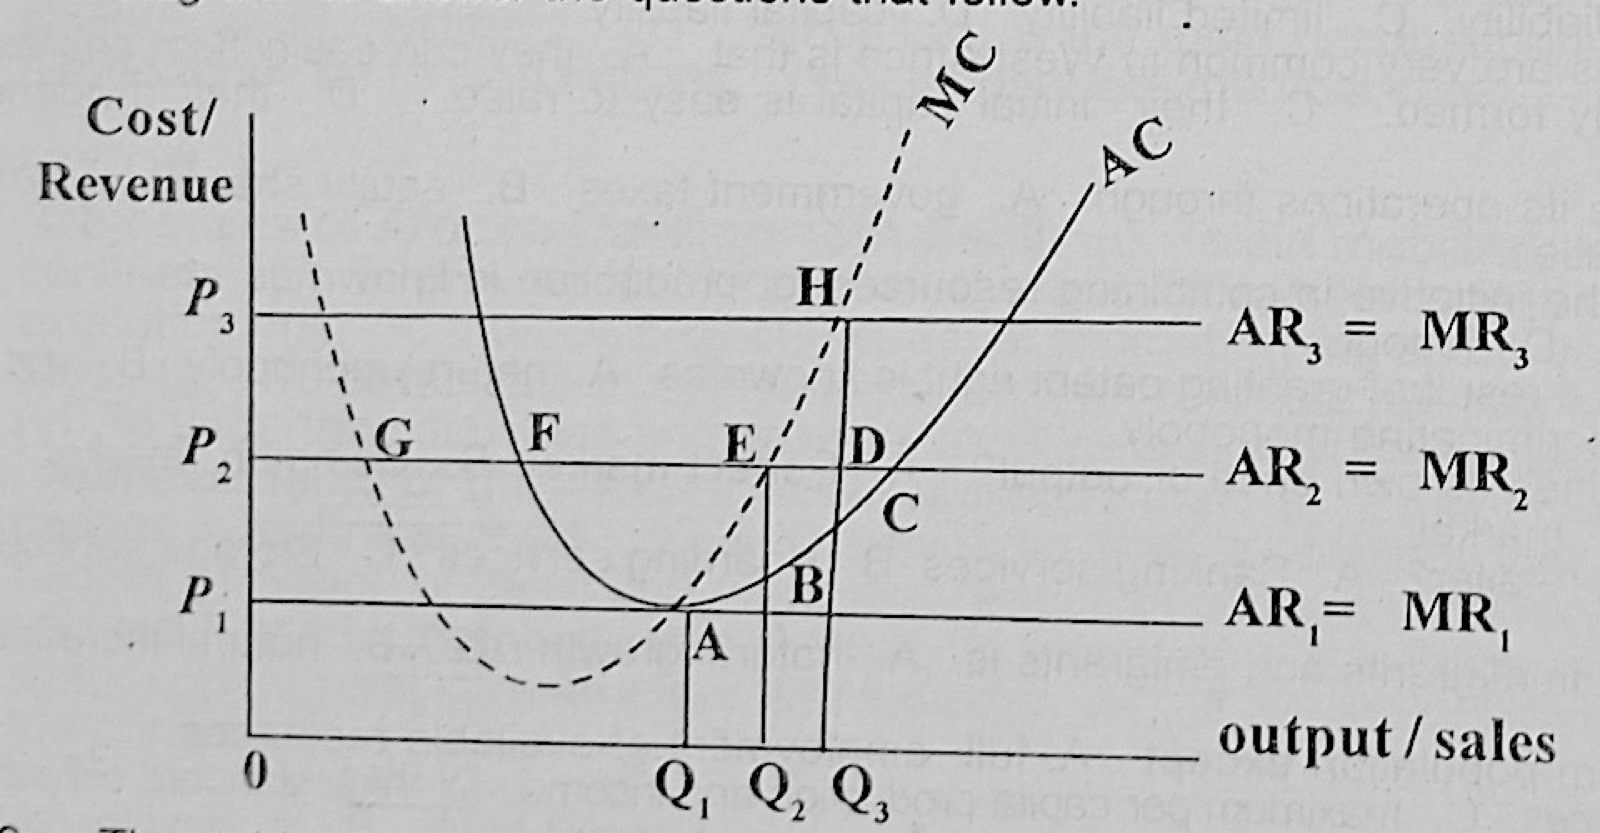
The diagram below represents the cost and revenue situation of a firm. Use the information in the diagram to answer the questions that follow. (a) Why would the firm not produce at (i) Q1; (ii) Q3? (b) How much profit does the firm make at P2? (c) If price falls to P1 (i) What quantity would the firm produce? (ii) What type of profit does the firm make? (iii) Explain your answer in c(ii). (d) In which type of market is the firm operating?
Show the model answer
Model answer
(a) At price P2 the profit-maximising output is Q2, where MC = MR2 (point E). (i) At Q1, MR2 is greater than MC, so producing more units adds to profit; Q1 is not the best output. (ii) At Q3, MC (point H) is greater than MR2, so the last units add more to cost than to revenue and reduce profit. (b) Profit = (price − average cost) × quantity = (P2 − AC at Q2) × OQ2 = EB × OQ2, the rectangle between P2 and the AC curve above OQ2: supernormal (abnormal) profit. (c)(i) Q1, where MC = MR1 (point A). (ii) Normal profit only. (iii) At Q1, AR = AC (price equals minimum average cost); normal profit is included in average cost, so there is no supernormal profit. (d) Perfect competition (AR = MR are horizontal lines: the firm is a price taker).
Explanation
Profit is maximised where MC = MR; profit is the gap between AR and AC times quantity.
The tables below show the expected revenues and projected expenditures from the budget of a hypothetical country in 1998. Use the information in the tables to answer the questions that follow. EXPECTED REVENUE Item | Amount ($ millions) Rents, royalties and profits | 75.00 Company income tax | 150.00 Customs and excise duties | 300.20 Personal income tax | 80.00 Fees and specific charges | 60.80 Value added tax | 100.00 PROJECTED EXPENDITURE Item | Amount ($ millions) General administration | 220.10 Maintenance of foreign missions | 50.00 Transfer payments | 65.00 Building of schools and hospitals | 200.00 Road construction | 180.90 (a) Calculate the total revenue from (i) direct taxes; (ii) indirect taxes; (iii) non-tax sources. (b) Determine the total (i) capital expenditure; (ii) recurrent expenditure. (c) Determine whether the budget is a surplus or deficit.
Show the model answer
Model answer
(a)(i) Direct taxes = company income tax 150.00 + personal income tax 80.00 = $230.00 m (ii) Indirect taxes = customs and excise 300.20 + VAT 100.00 = $400.20 m (iii) Non-tax = rents, royalties and profits 75.00 + fees and specific charges 60.80 = $135.80 m Total revenue = $766.00 m (b)(i) Capital expenditure = schools and hospitals 200.00 + roads 180.90 = $380.90 m (ii) Recurrent expenditure = general administration 220.10 + foreign missions 50.00 + transfer payments 65.00 = $335.10 m Total expenditure = $716.00 m (c) Revenue (766.00) is greater than expenditure (716.00), so the budget is a surplus of $50.00 m.
Explanation
Capital spending creates lasting assets; recurrent spending is regular running cost.
Explain how the following factors will affect the demand for a commodity X: (a) a decrease in the price of a complement Y; (b) an increase in consumers' disposable income; (c) a decrease in the supply of a substitute P; (d) an increase in income tax.
Show the model answer
Model answer
(a) Y becomes cheaper, so more Y is bought; since X is used with Y, demand for X increases (curve shifts right). (b) Higher disposable income raises demand for X if it is a normal good (shift right); if X is inferior, demand falls. (c) Less supply of P raises its price, so consumers switch to X: demand for X increases. (d) Higher income tax reduces disposable income, so demand for X (a normal good) decreases (shift left).
(a) State and explain the law of comparative cost advantage. (b) Give two limitations of the law as a theory of international trade.
Show the model answer
Model answer
(a) The law states that even if one country is more efficient than another in producing all goods, both gain from trade if each specialises in producing the good in which it has the greater relative advantage (lowest opportunity cost) and trades for the other. Explain with an example of two countries and two goods. (b) Any two: it assumes no transport costs; assumes free trade (ignores tariffs and quotas); assumes perfect mobility of factors within a country and immobility between countries; assumes constant costs (ignores diminishing returns); considers only two countries and two goods; assumes full employment; ignores the need for self-sufficiency in strategic goods.
Explanation
Use opportunity cost to show which country should specialise in which good.
(a) Define money. (b) State the three motives for holding money. (c) Mention two determinants of each of the motives for holding money.
Show the model answer
Model answer
(a) Money is anything that is generally acceptable as a medium of exchange and in settlement of debts. (b) Transactions motive; precautionary motive; speculative motive. (c) Transactions: level of income; frequency of payment of income; price level; habits of spending. Precautionary: level of income; uncertainty about the future (emergencies); availability of credit; age and family size. Speculative: rate of interest; expectations about future bond prices/interest rates; level of wealth.
(a) Distinguish between economic activities and an economic system. (b) Explain the following terms: (i) production; (ii) distribution; (iii) consumption.
Show the model answer
Model answer
(a) Economic activities are the things people do to earn a living or satisfy wants with scarce resources (production, distribution, consumption). An economic system is the way a society organises its resources and institutions to carry out these activities and decide what, how and for whom to produce (e.g. capitalism, socialism). (b)(i) Production: the creation of goods and services (utility) to satisfy human wants, including moving them to consumers. (ii) Distribution: the movement of goods from producers to consumers through wholesalers, retailers, transport, etc. (also the sharing of income among factors). (iii) Consumption: the using up of goods and services to satisfy wants.
Explanation
Activities are what people do; a system is how society organises them.
(a) Define (i) elasticity of demand; (ii) price elasticity of demand. (b) State any four determinants of price elasticity of demand. (c) Draw curves illustrating (i) fairly elastic demand; (ii) perfectly inelastic demand.
Show the model answer
Model answer
(a)(i) Elasticity of demand is the degree of responsiveness of quantity demanded to a change in any of its determinants (price, income, prices of other goods). (ii) Price elasticity of demand is the responsiveness of quantity demanded to a change in the good's own price: % change in quantity demanded ÷ % change in price. (b) Any four: availability of substitutes; nature of the good (necessity or luxury); proportion of income spent on it; number of uses; habit; durability; time period; whether purchase can be postponed. (c)(i) A relatively flat downward-sloping demand curve (a small price change gives a larger change in quantity). (ii) A vertical demand curve (quantity does not change whatever the price).
(a) Define market in economics. (b) State any three features of a monopoly. (c) Outline any three sources of monopoly power.
Show the model answer
Model answer
(a) A market is any arrangement through which buyers and sellers of a commodity are in contact to exchange it at a price. (b) Any three: a single seller; no close substitutes; barriers to entry; the firm is a price maker; the firm is the industry; can practise price discrimination; can earn abnormal profit in the long run. (c) Any three: patents and copyrights; government licence/legislation (statutory monopoly); control of a scarce raw material; large economies of scale (natural monopoly); huge capital requirement; mergers and cartels; exclusive franchise.
Explanation
Sources of monopoly power are the barriers that keep rivals out.
(a) With the aid of a diagram, explain a minimum price. (b) State any five measures by which a minimum price for an agricultural produce can be made effective.
Show the model answer
Model answer
(a) A minimum (floor) price is a price fixed by government above the equilibrium, below which the good may not be sold, usually to protect producers. Diagram: D and S curves crossing at Pe; a horizontal line at Pmin above Pe; quantity supplied exceeds quantity demanded, showing a surplus. (b) Any five: government buys up the surplus (buffer stock); storage facilities for the surplus; export of the surplus; output quotas to restrict production; laws and penalties against selling below the price; subsidies for processing into other products; destroying or giving away surplus as aid; encouraging local consumption.
Explanation
The surplus at the minimum price must be absorbed or controlled.
(a) What is a supply schedule? (b) Using an example, show how a market supply schedule of a product is obtained from individual supply schedules. (c) State three examples of exceptional demand.
Show the model answer
Model answer
(a) A supply schedule is a table showing the quantities of a commodity that a seller (or sellers) is willing and able to offer for sale at various prices at a given time. (b) Add the quantities supplied by all sellers at each price. Example: at N10, A supplies 20, B 30, C 50 → market supply 100; at N20, A 30, B 40, C 60 → 130; at N30, A 40, B 50, C 70 → 160. (c) Any three: Giffen goods; goods of ostentation (prestige/Veblen goods); goods whose price is expected to rise further; goods bought in ignorance (price taken as a sign of quality); necessities in an emergency.
Explanation
Market supply is the horizontal sum of individual supplies at each price.
Distinguish between the following: (a) wants and effective demand; (b) demand schedule and demand curve; (c) individual demand and market demand; (d) change in demand and change in quantity demanded.
Show the model answer
Model answer
(a) Wants are desires for goods and services, not necessarily backed by money; effective demand is a want backed by willingness and ability to pay at a given price. (b) A demand schedule is a table of quantities demanded at different prices; a demand curve is the graph of that schedule. (c) Individual demand is the quantity one consumer buys at various prices; market demand is the total of all individual demands at each price. (d) A change in demand is caused by factors other than the good's own price and shifts the whole curve; a change in quantity demanded is caused by a change in the good's own price and is a movement along the same curve.
(a) Describe the output method of measuring the gross domestic product of a country. (b) How is the net national product at factor cost obtained from gross domestic product? (c) State two problems associated with the output method.
Show the model answer
Model answer
(a) The output (product) method adds up the money value of all final goods and services produced by all sectors (agriculture, mining, manufacturing, services) in the country in a year; to avoid double counting, only final goods or value added at each stage are counted. (b) GDP at market prices + net factor income from abroad = GNP at market prices; − depreciation = NNP at market prices; − indirect taxes + subsidies = NNP at factor cost (national income). (c) Any two: double counting; difficulty of valuing subsistence output not sold; inadequate and unreliable data; difficulty in deciding which goods are final; changes in prices; illiteracy of producers who keep no records.
Explanation
Show the adjustments step by step from GDP to NNP at factor cost.