Theory question 102
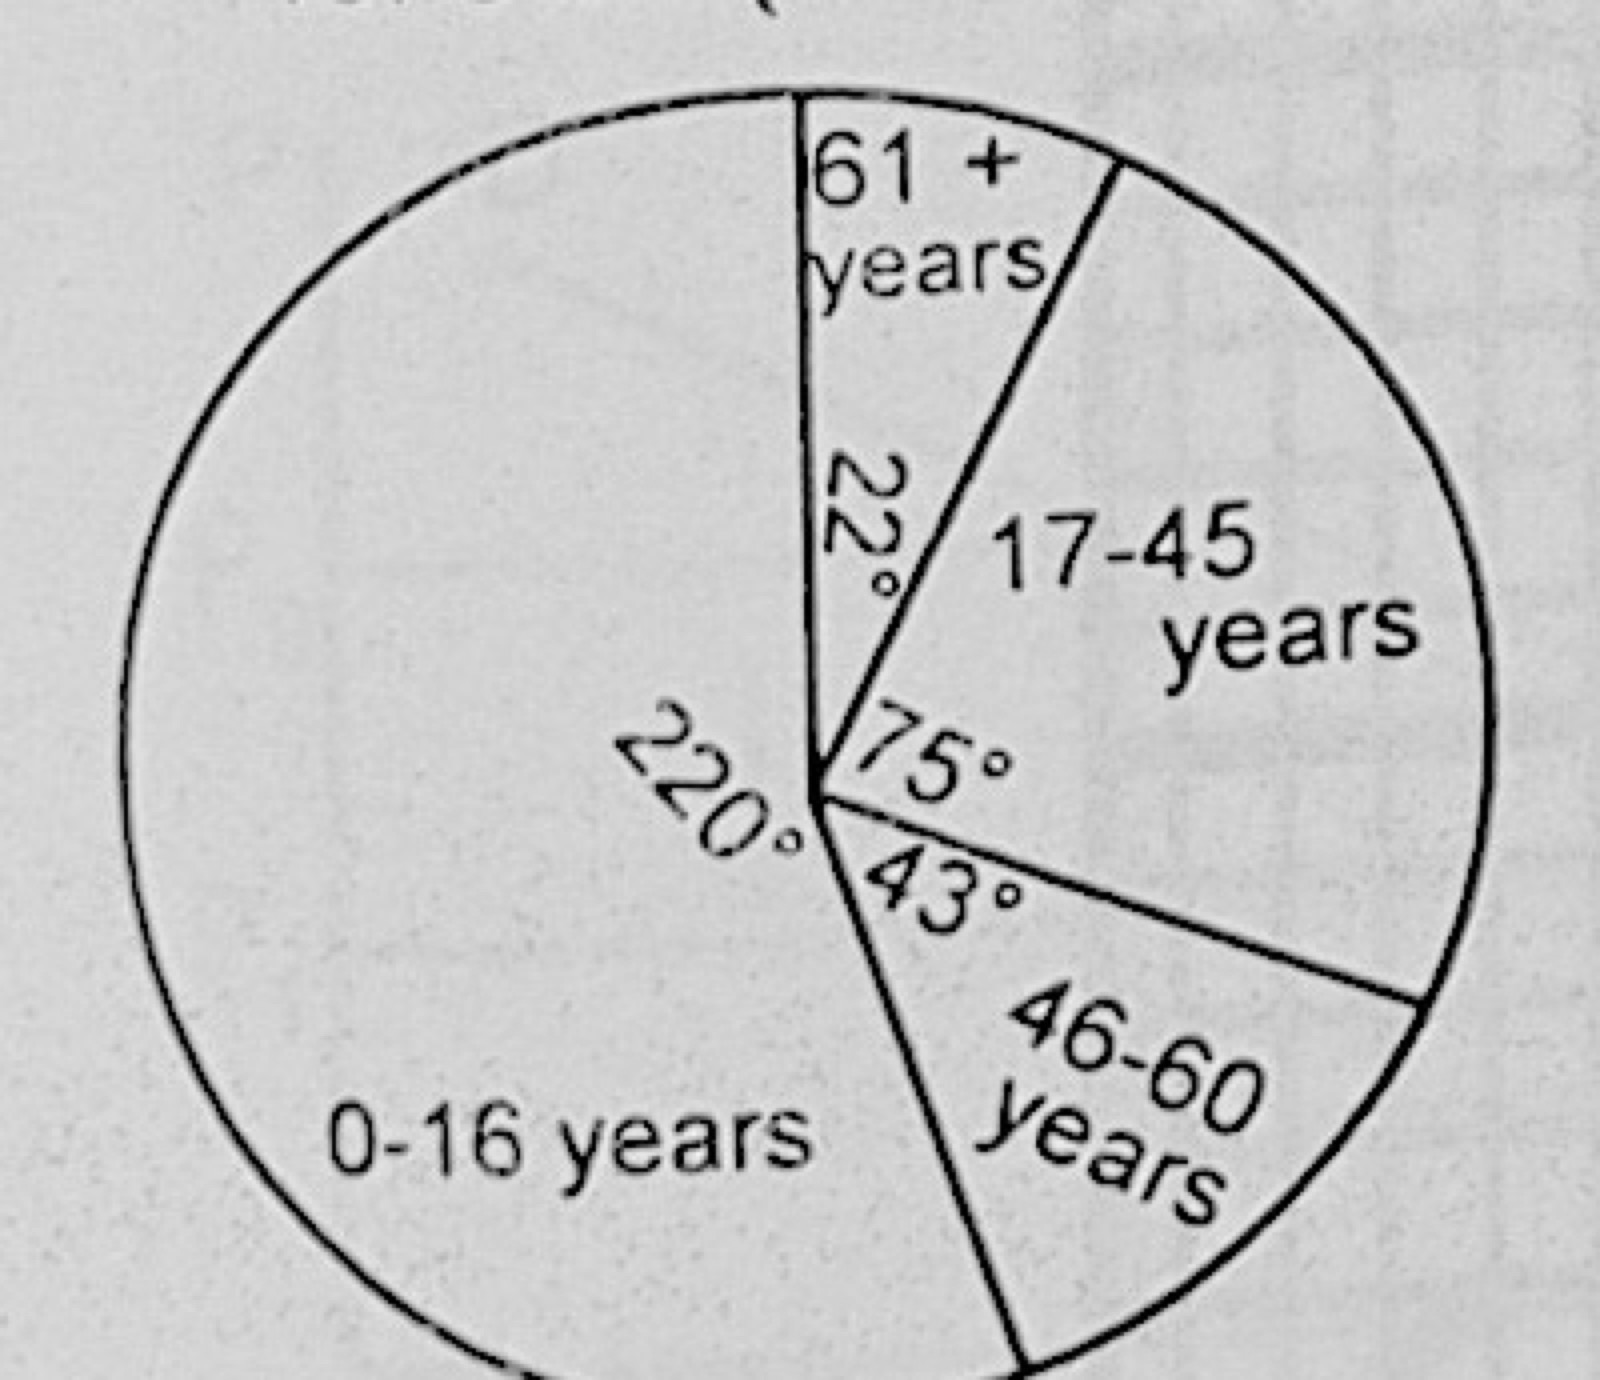
PopulationThe pie chart below shows the age distribution of population in thousands of an island Y for the year 2000. The total population of the island is 245,000. Use the information supplied to answer the questions that follow. (Show all workings clearly).
(a) Calculate the number of persons in the different age groups.
(b) What is the dependency ratio of the population?
(c) Give three implications of the above population structure.
Show the model answer
(a) 0–16 years: 220/360 × 245,000 = 149,722
17–45 years: 75/360 × 245,000 = 51,042
46–60 years: 43/360 × 245,000 = 29,264
61+ years: 22/360 × 245,000 = 14,972
(b) Dependants (0–16 and 61+) = 164,694; working population (17–60) = 80,306
Dependency ratio = 164,694 ÷ 80,306 ≈ 2.05 (about 205 dependants per 100 workers)
(c) Any three: heavy burden on the small working population; low savings and investment; high government spending on schools, health and welfare; small labour force limits output; high future population growth because most people are young; low standard of living.
Each sector's share = its angle ÷ 360 × total population; dependants are the young and the old.