Theory question 101
ElasticitySection A (answer one question only from this section)
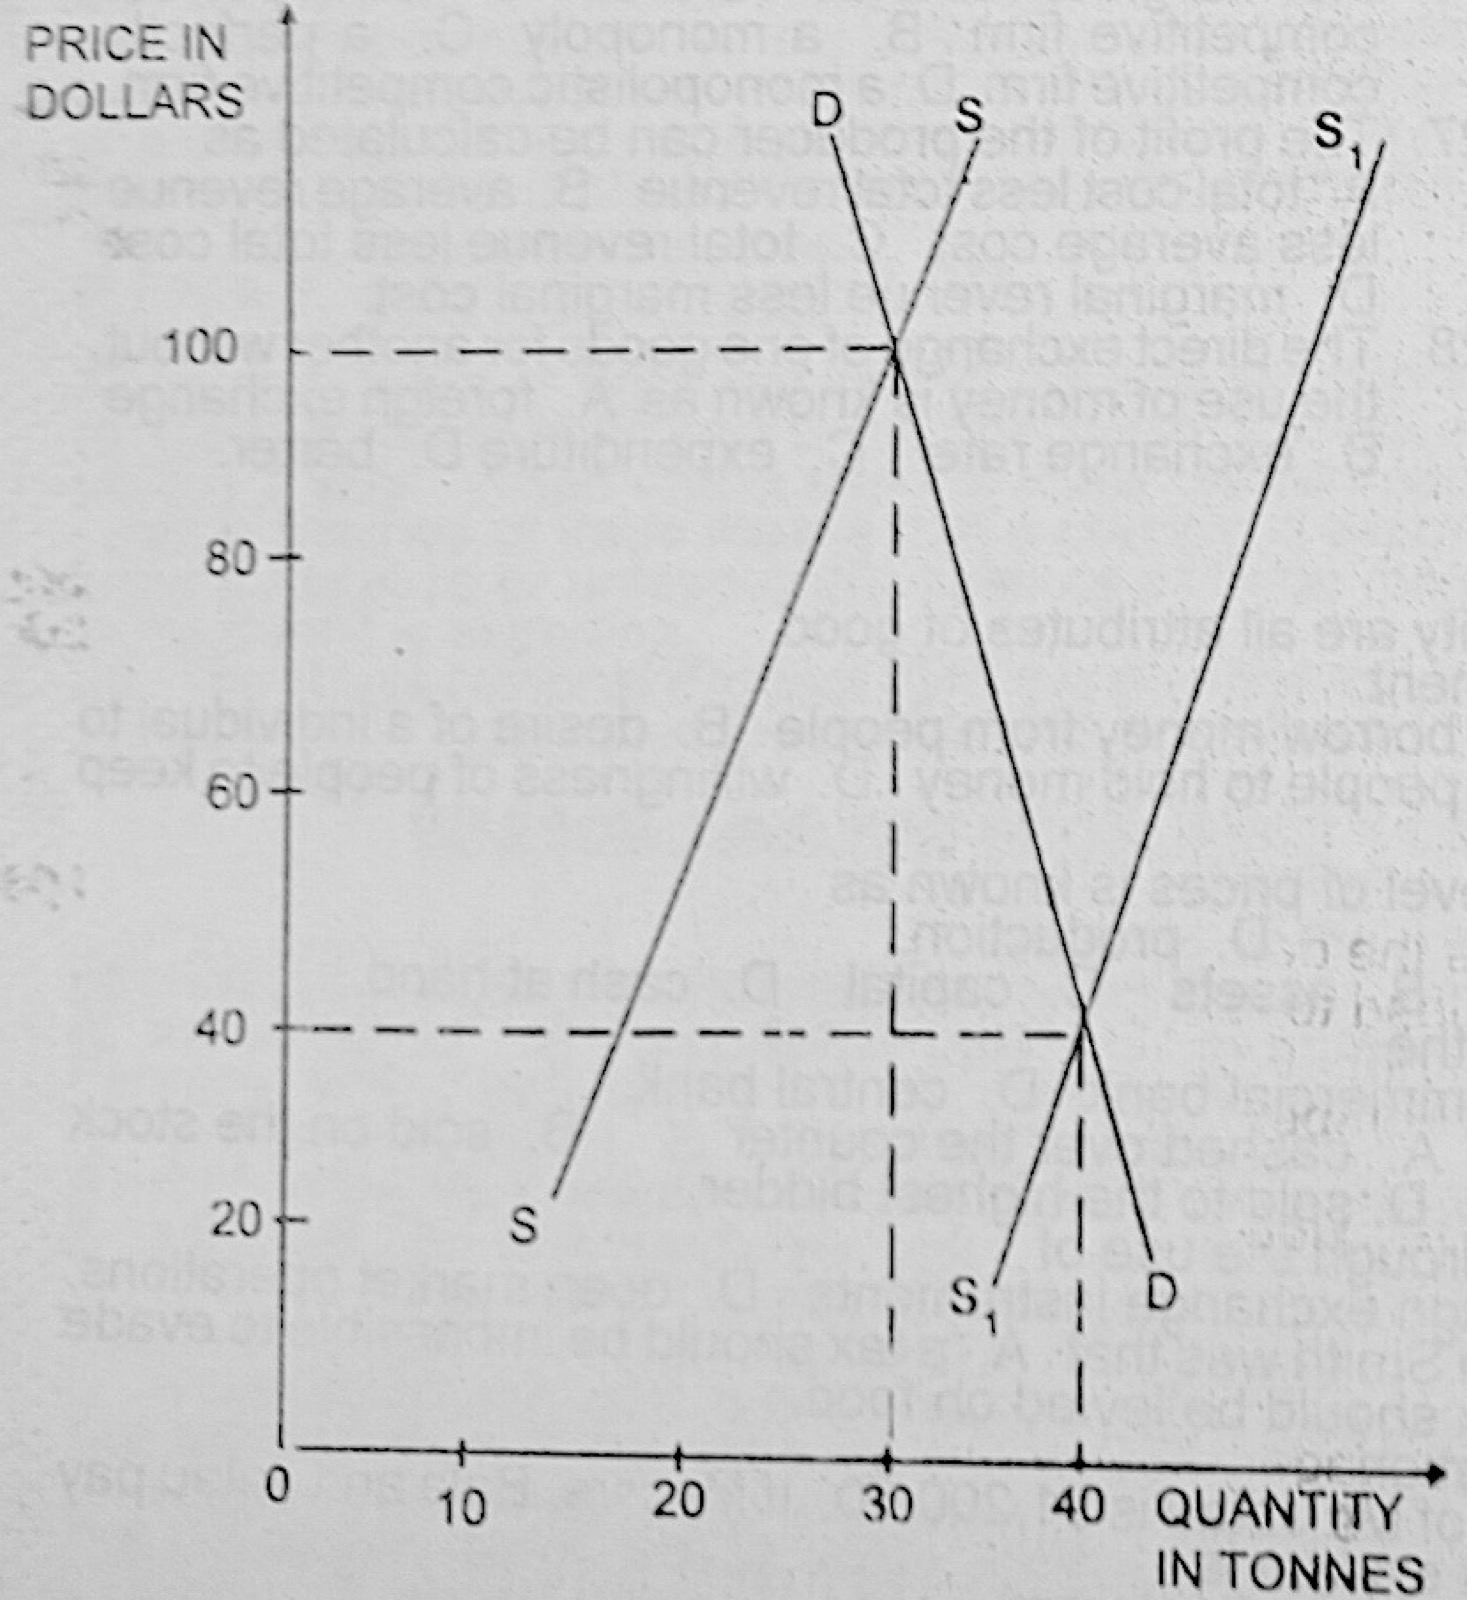
The diagram below illustrates the demand for and supply of maize. Use the information in the diagram to answer the questions that follow.
(a)(i) What is the total revenue of the farmer at the initial equilibrium? (ii) Calculate the total revenue of the farmer if the supply curve shifts to S1S1.
(b) What change occurs in the total revenue of the farmer when the price falls from 100 Dollars to 40 Dollars per tonne?
(c)(i) Use the figures in the diagram to determine the price elasticity of demand for maize. (ii) Interprete your answer.
(d) Give two reasons for the shift of the supply curve from SS to S1S1.
Show the model answer
(a)(i) Initial equilibrium (DD and SS): price $100, quantity 30 tonnes; TR = 100 × 30 = $3,000.
(ii) New equilibrium (DD and S1S1): price $40, quantity 40 tonnes; TR = 40 × 40 = $1,600.
(b) Total revenue falls by 3,000 − 1,600 = $1,400.
(c)(i) % change in quantity = 10/30 × 100 = 33.3%; % change in price = 60/100 × 100 = 60%; PED = 33.3 ÷ 60 ≈ 0.56.
(ii) PED is less than 1, so demand for maize is inelastic: the price fall raises quantity demanded proportionately less, which is why total revenue falls.
(d) Any two: good weather/bumper harvest; improved technology or high-yield seeds; fall in the cost of inputs (fertiliser, labour); government subsidies; more farmers entering maize production; fall in prices of other crops the farmer could grow.
Read both equilibrium points off the diagram; a supply increase shifts the curve to the right.