Theory question 101
Market StructuresSection A (data response: answer one question only from this section)
(a) When is a monopoly in equilibrium?
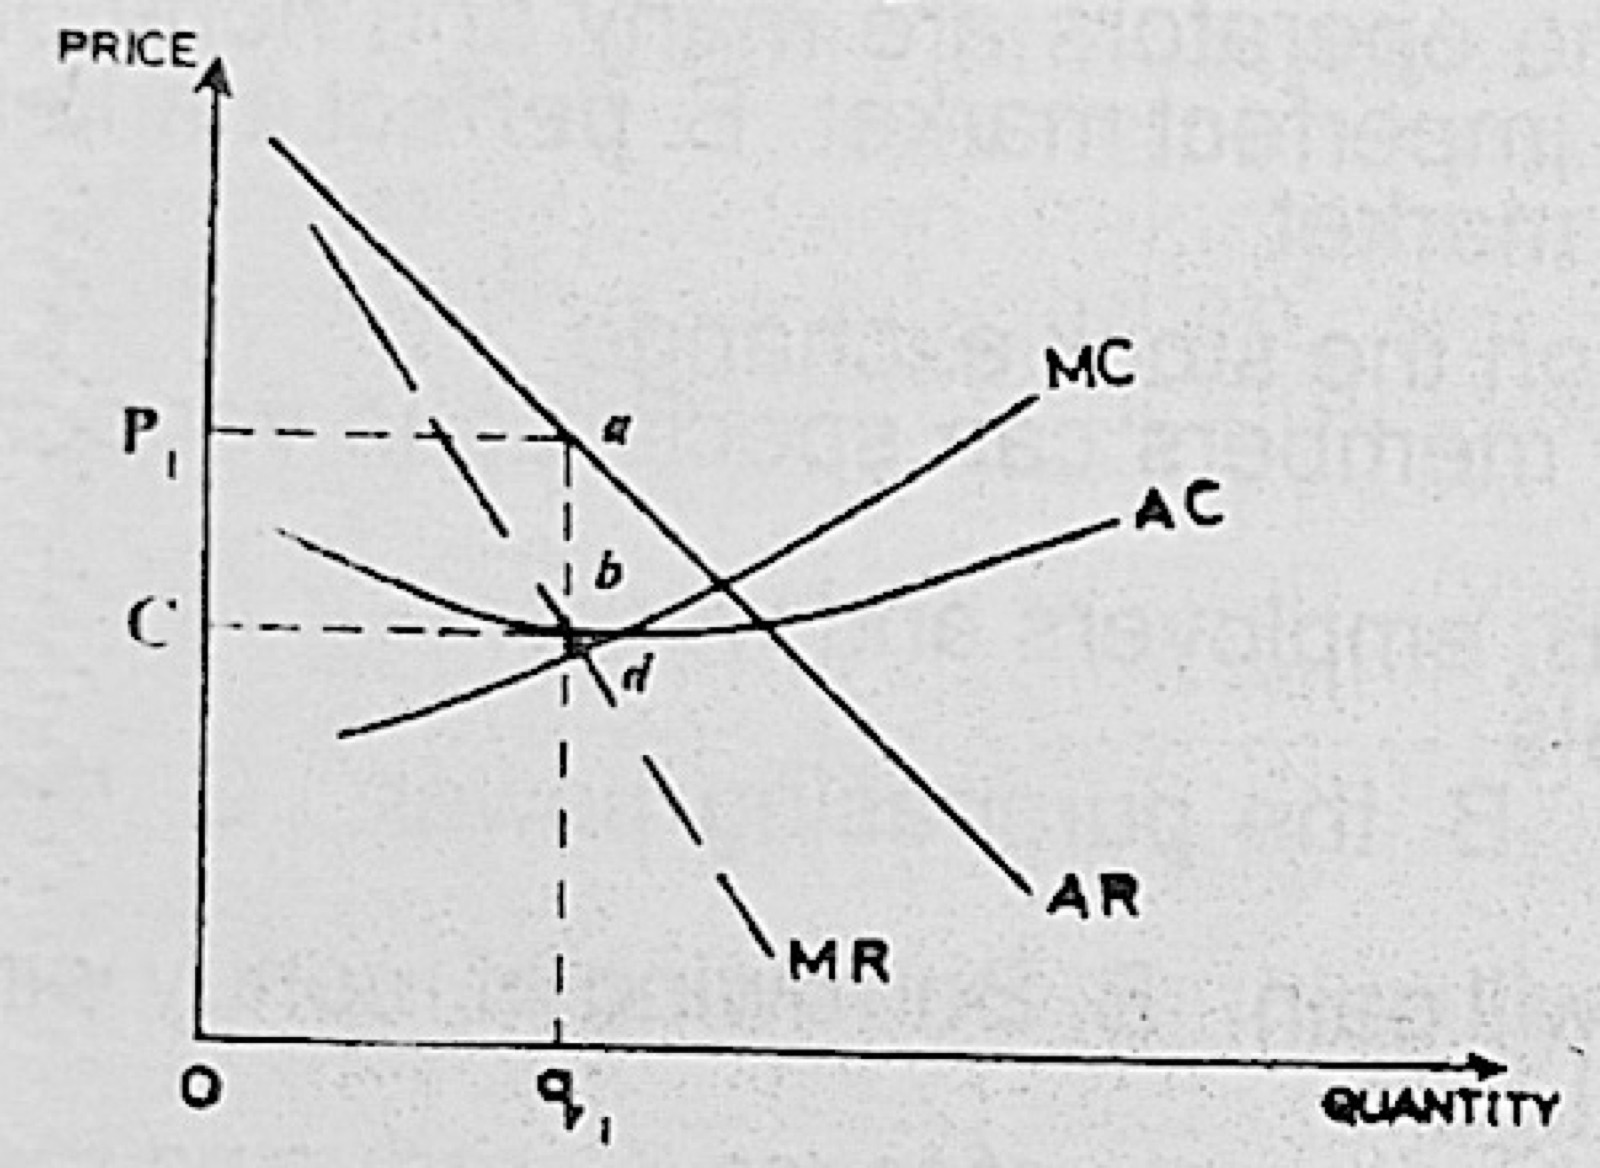
Use the diagram below to answer the questions that follow.
(b)(i) Which of the curves represents the monopoly demand curve? (ii) What is the point d on the diagram? (iii) State the equilibrium price and quantity. (iv) Which area represents the monopoly profits?
(c) If P1 = 5 Naira and q1 = 50 units and C = 2 Naira, determine the monopoly profit.
Show the model answer
(a) A monopolist is in equilibrium (maximising profit) when marginal cost equals marginal revenue (MC = MR), with MC cutting MR from below.
(b)(i) The AR curve is the monopolist's demand curve.
(ii) d is the point where MC = MR: the equilibrium (profit-maximising) point.
(iii) Equilibrium quantity is Oq1; equilibrium price is OP1 (read up from q1 to the AR curve).
(iv) The rectangle P1abC (the gap between price and average cost multiplied by output).
(c) Profit = (price − average cost) × quantity = (5 − 2) × 50 = N150 (TR = 250, TC = 100).
Output is set where MC = MR; price is read from the demand (AR) curve above that output.