Question 2
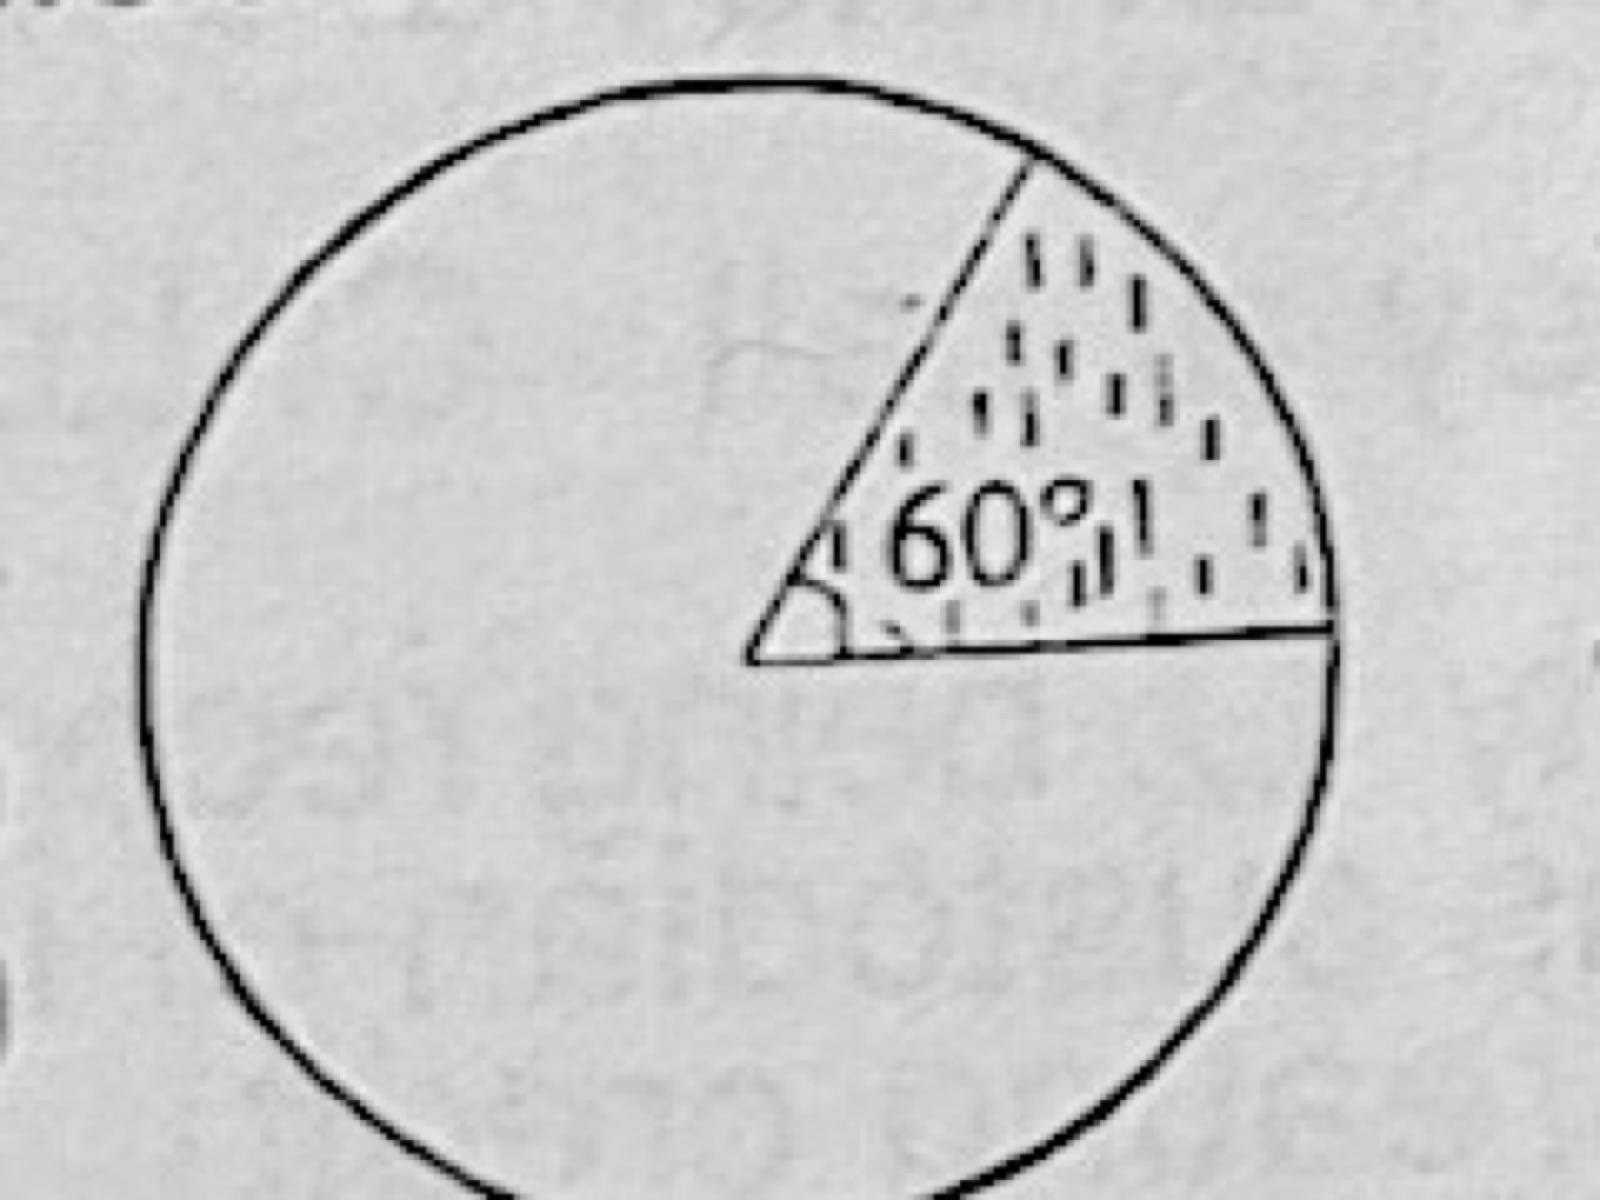
Tools of Economic AnalysisThe pie-chart below represents the total population of a school of 1,200. The shaded area of 60° shows the population of the underaged pupils. What is the population of the matured students?
- A.600
- B.800
- C.1,000
- D.1,200
Show the answer and explanation
Answer: C (1,000)
Explanation
Matured students take 360° − 60° = 300°, so 300/360 × 1,200 = 1,000.