Theory question 101
Tools of Economic AnalysisSection A (answer one question only from this section)
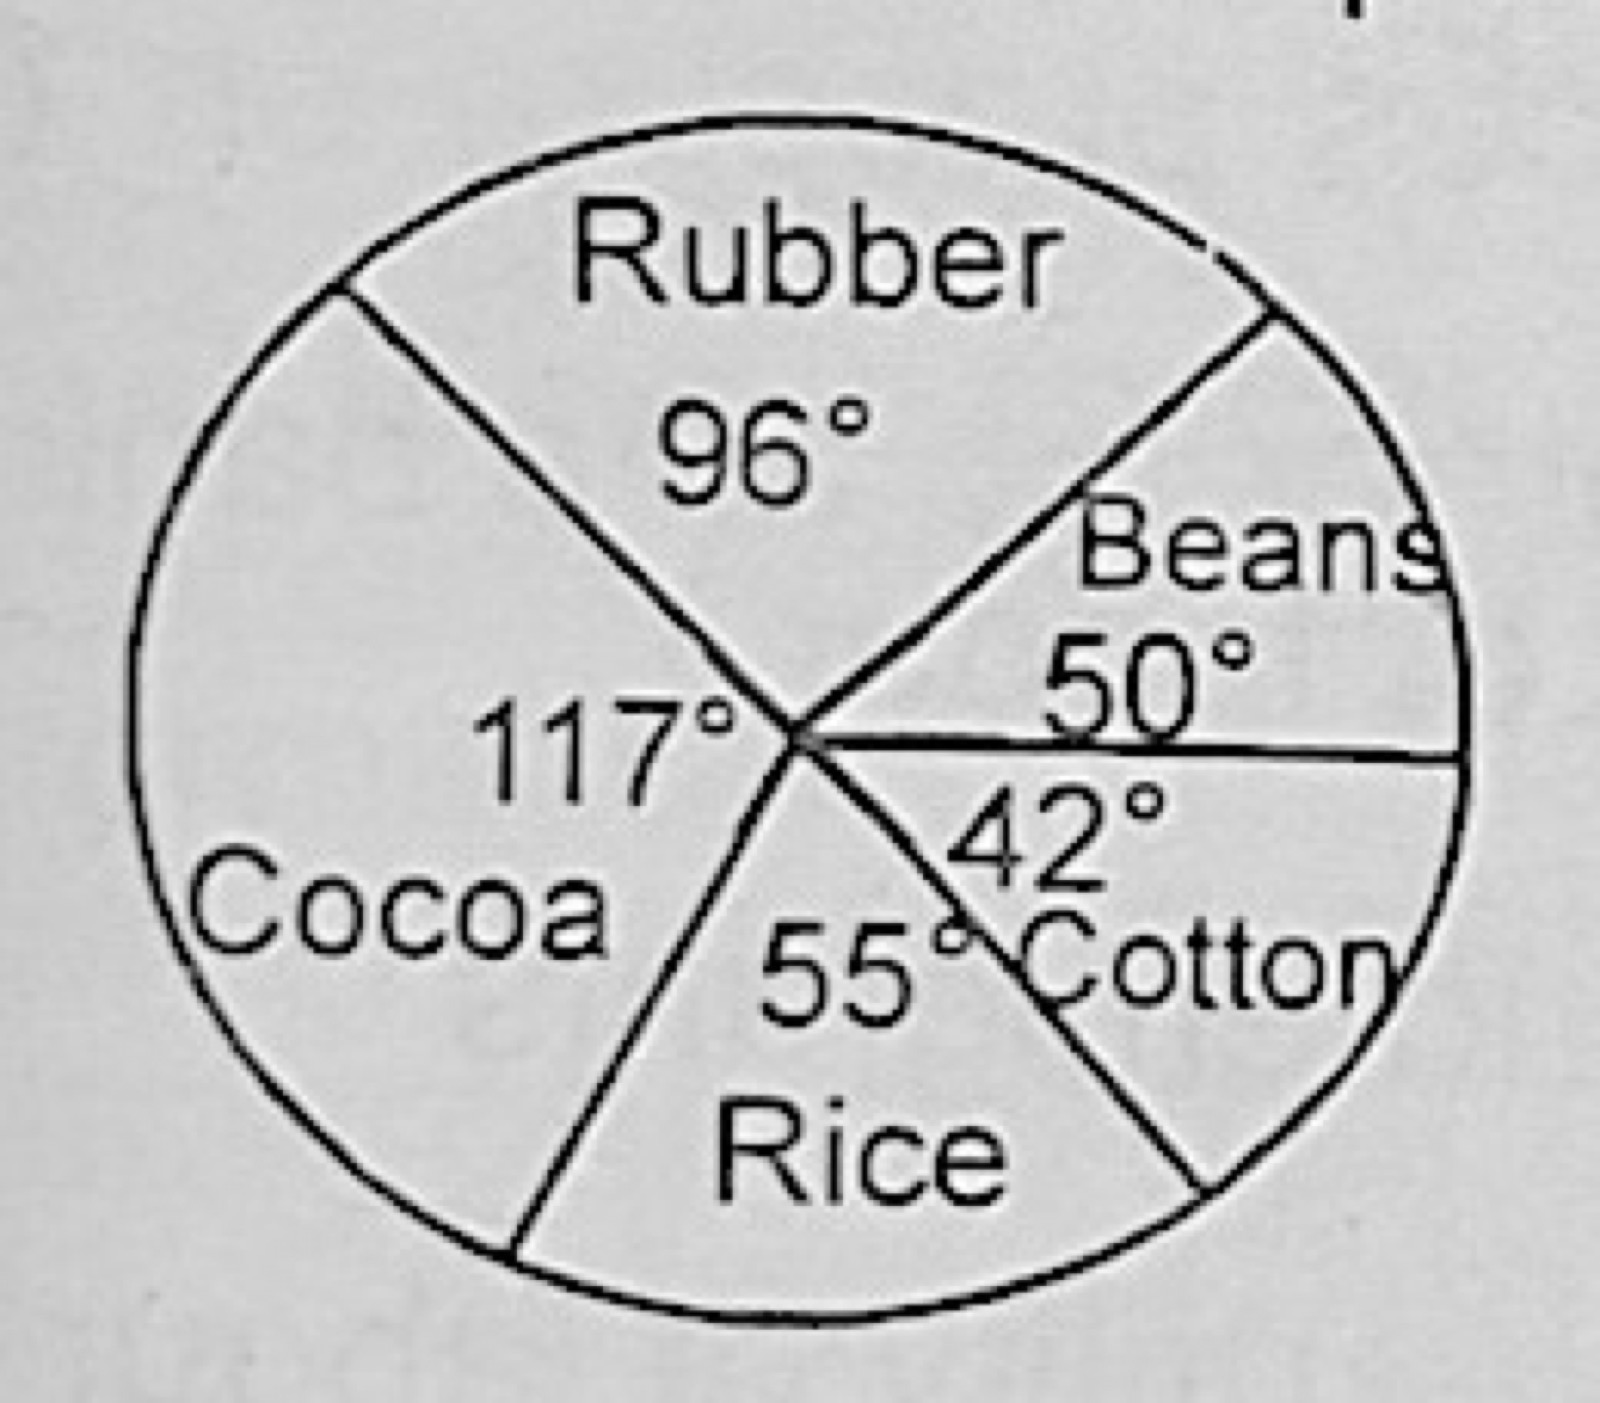
The pie chart below represents the hypothetical output of farmers in a country in a particular year. The total output of the crops was 72,000 tonnes. (Sectors: Cocoa 117°, Rubber 96°, Beans 50°, Cotton 42°, Rice 55°.)
(a) Calculate the quantity of each product.
(b)(i) By what quantity is the export crops greater than the food crops? (ii) Which crop contributed the least and by what quantity? (iii) Which crop has the highest output?
Show the model answer
(a) Each degree = 72,000 ÷ 360 = 200 tonnes.
Cocoa = 117 × 200 = 23,400 tonnes; Rubber = 96 × 200 = 19,200 tonnes; Beans = 50 × 200 = 10,000 tonnes; Cotton = 42 × 200 = 8,400 tonnes; Rice = 55 × 200 = 11,000 tonnes.
(b)(i) Export crops (cocoa, rubber, cotton) = 23,400 + 19,200 + 8,400 = 51,000 tonnes; food crops (beans, rice) = 10,000 + 11,000 = 21,000 tonnes; difference = 30,000 tonnes.
(ii) Cotton contributed the least, 8,400 tonnes (15,000 tonnes less than cocoa, the largest).
(iii) Cocoa has the highest output (23,400 tonnes).
Find tonnes per degree first (total ÷ 360), then multiply each angle.