Question 14
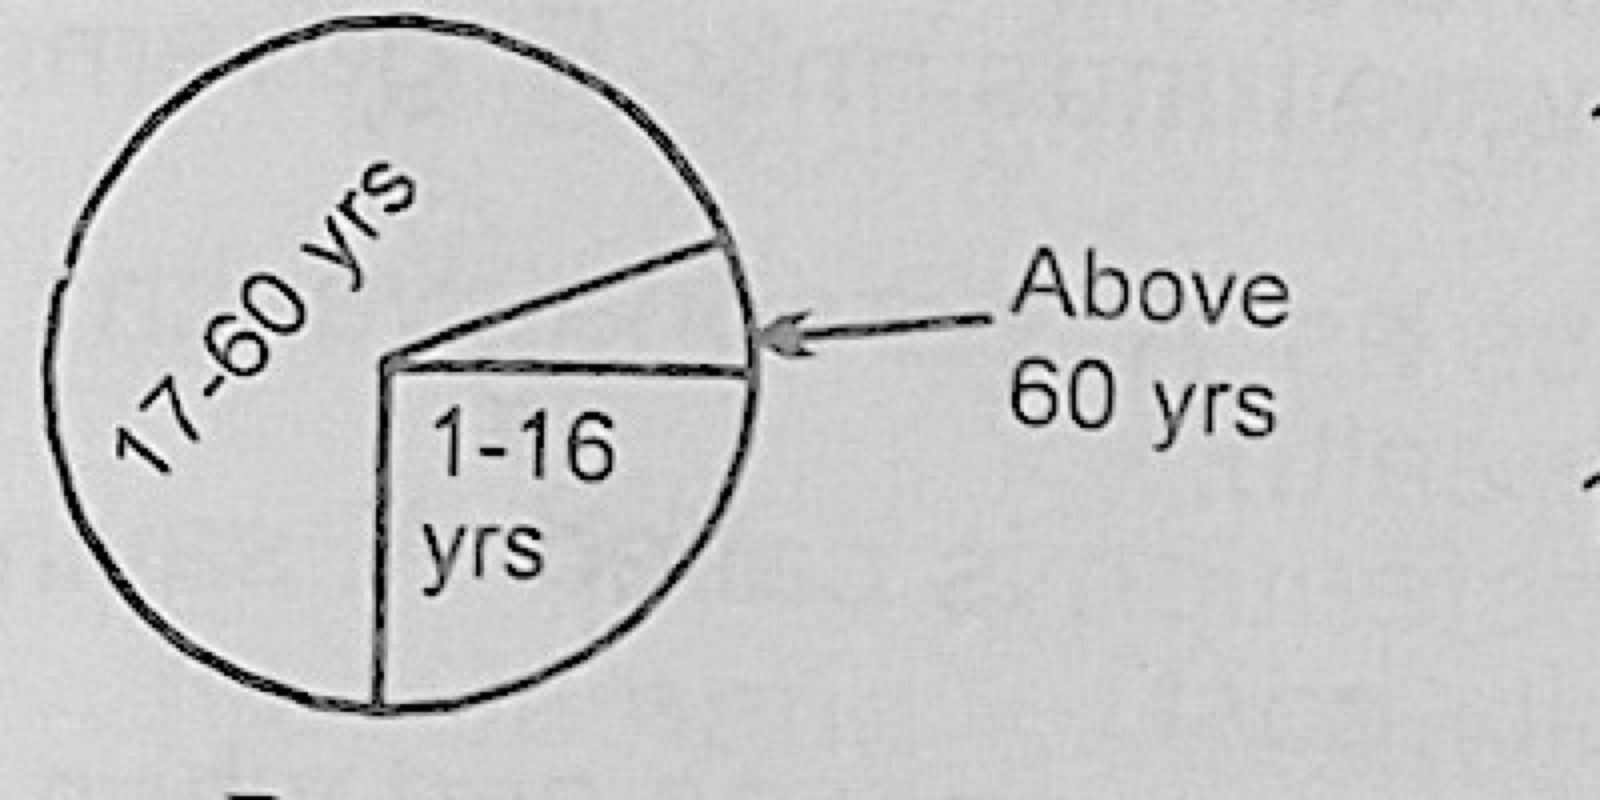
Tools of Economic AnalysisThe diagram below is a
- A.bar chart
- B.pie chart
- C.ball chart
- D.histogram
- E.histo-chart
Show the answer and explanation
Answer: B (pie chart)
Explanation
A circle divided into sectors, each showing a share of the whole, is a pie chart.