Question 22
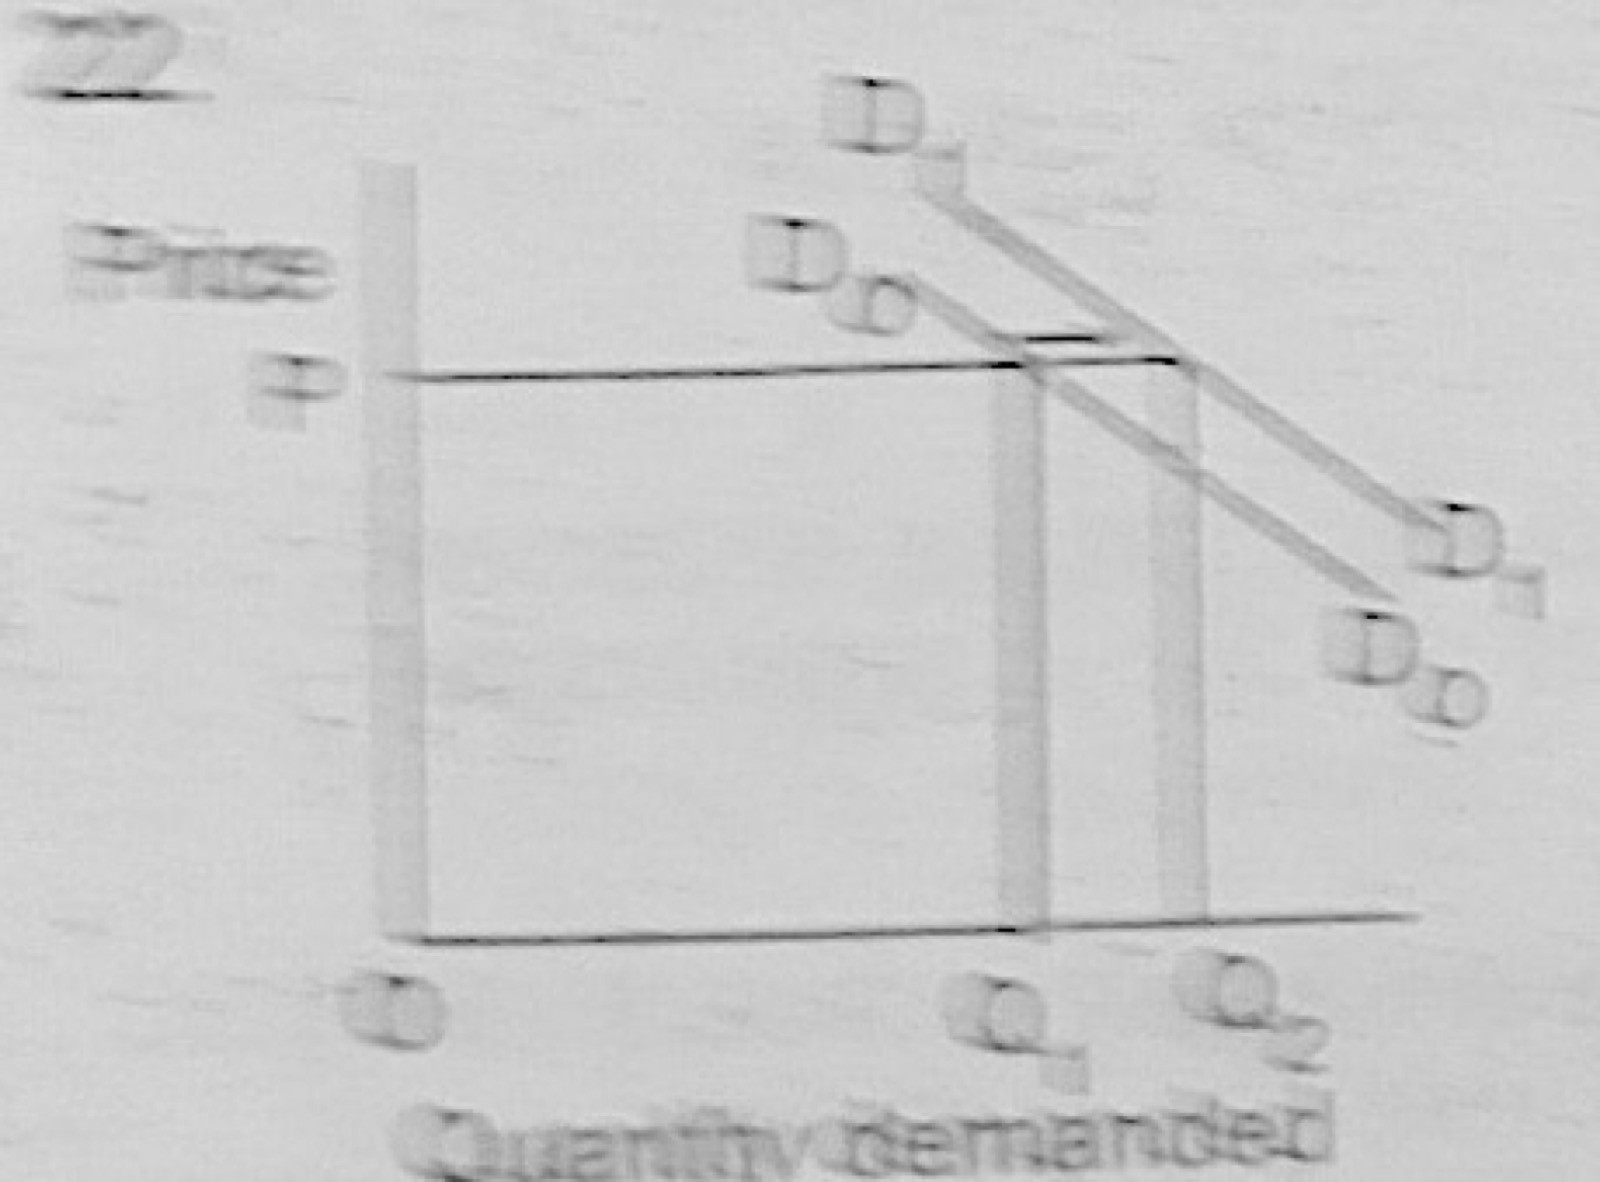
Theory of DemandThe above diagram represents
- A.an increase in demand
- B.an increase in quantity supplied
- C.a decrease in quantity demanded
- D.a decrease in demand
- E.a change in price.
Show the answer and explanation
Answer: A (an increase in demand)
Explanation
The demand curve shifts from Do to D1 (to the right): at the same price P more is demanded (Q2 instead of Q1), an increase in demand.