Question 20
SpreadsheetThe Microsoft Excel menu bar icon shown in Figure 2 is used to
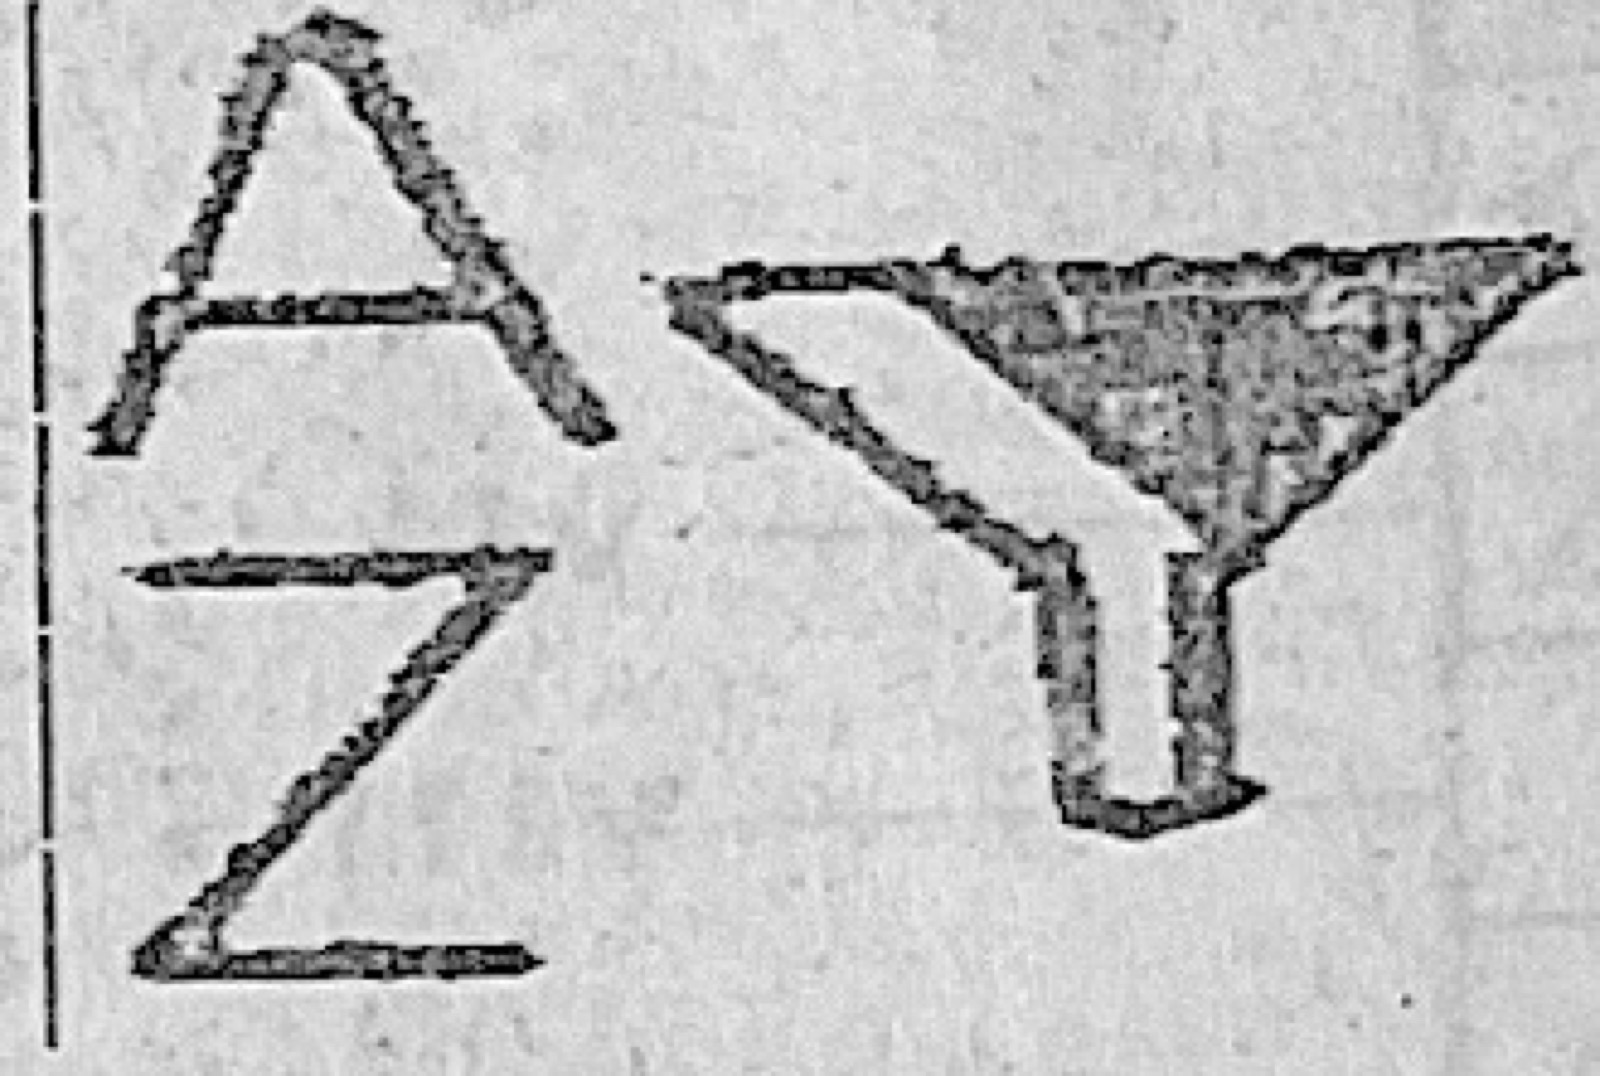
- A.automatically add up selected values.
- B.create label that spans multiple columns.
- C.spot trends and patterns in user's data using bars, columns and icons.
- D.organize data for easy analysis.
Show the answer and explanation
Answer: D (organize data for easy analysis.)
Explanation
The A–Z and funnel icon is Sort & Filter, which arranges and filters data for easy analysis.