Question 8
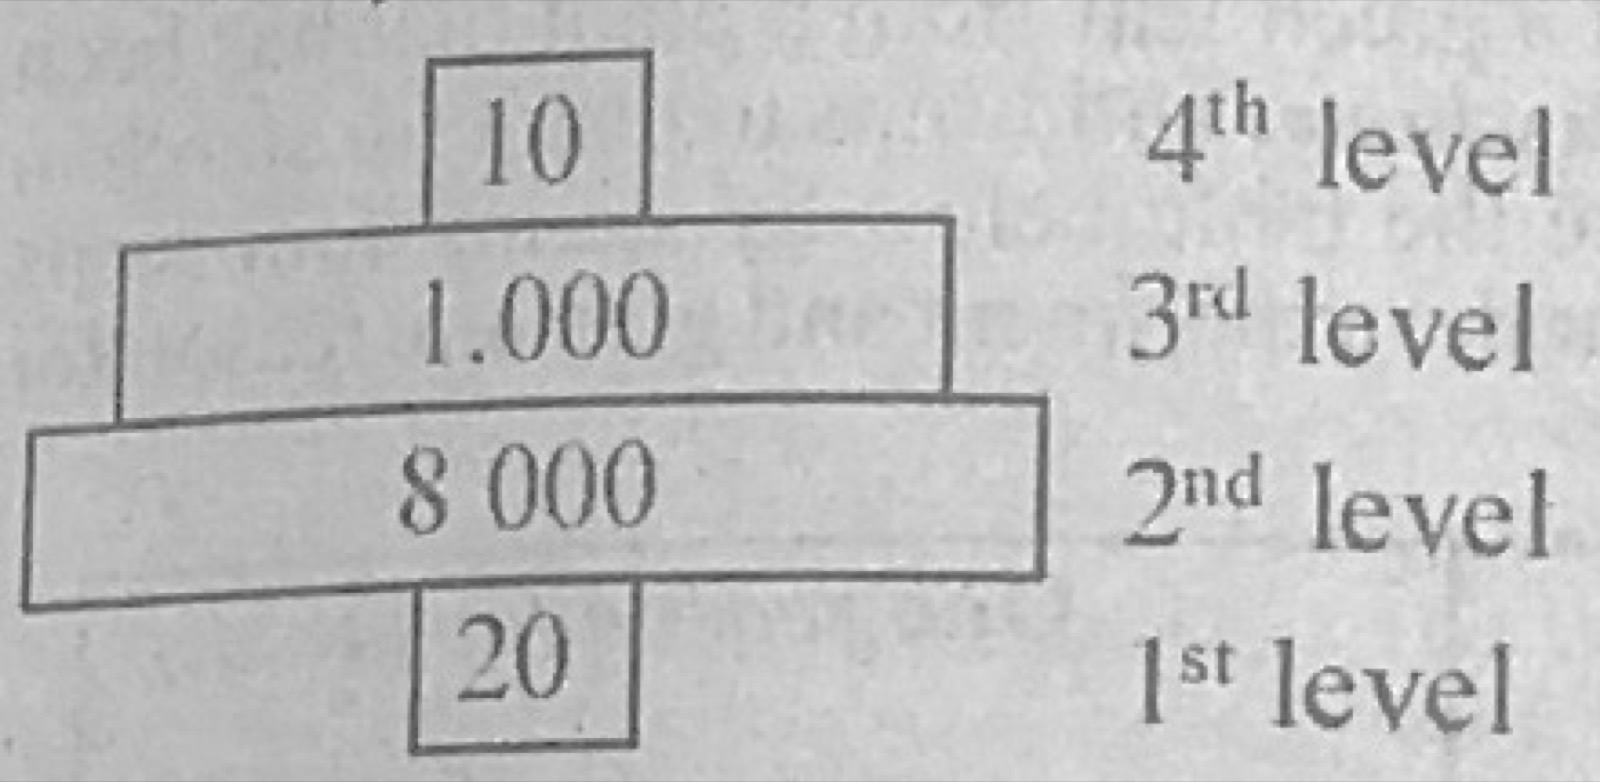
Feeding Relationships and Energy FlowThe diagram below is an illustration of an ecological pyramid.
4th level: 10
3rd level: 1,000
2nd level: 8 000
1st level: 20
The illustrated diagram is a pyramid of
- A.energy
- B.numbers
- C.organisms
- D.population
Show the answer and explanation
Answer: B (numbers)
Explanation
The values are counts of individuals at each feeding level, and a pyramid of numbers can have a narrow base when the producers are few large trees.