Question 29
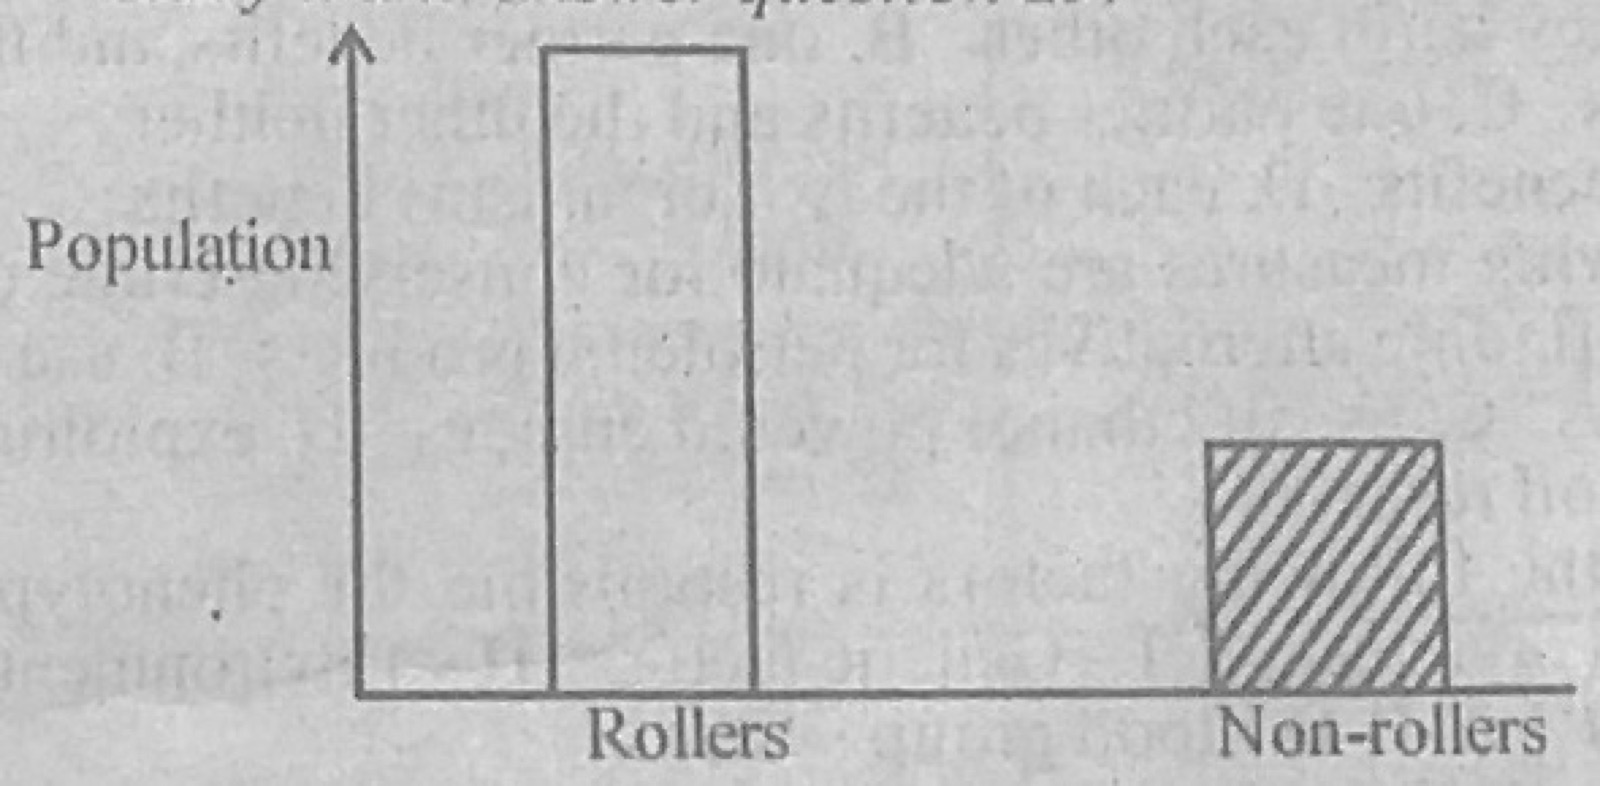
VariationThe diagram below is an illustration of the percentage of tongue rollers and non-tongue rollers in a human population. The type of variation in the illustrated diagram is
- A.adaptive
- B.continuous
- C.discontinuous
- D.environmental
Show the answer and explanation
Answer: C (discontinuous)
Explanation
People are either rollers or non-rollers, with no in-between groups, so the variation is discontinuous.