Question 47
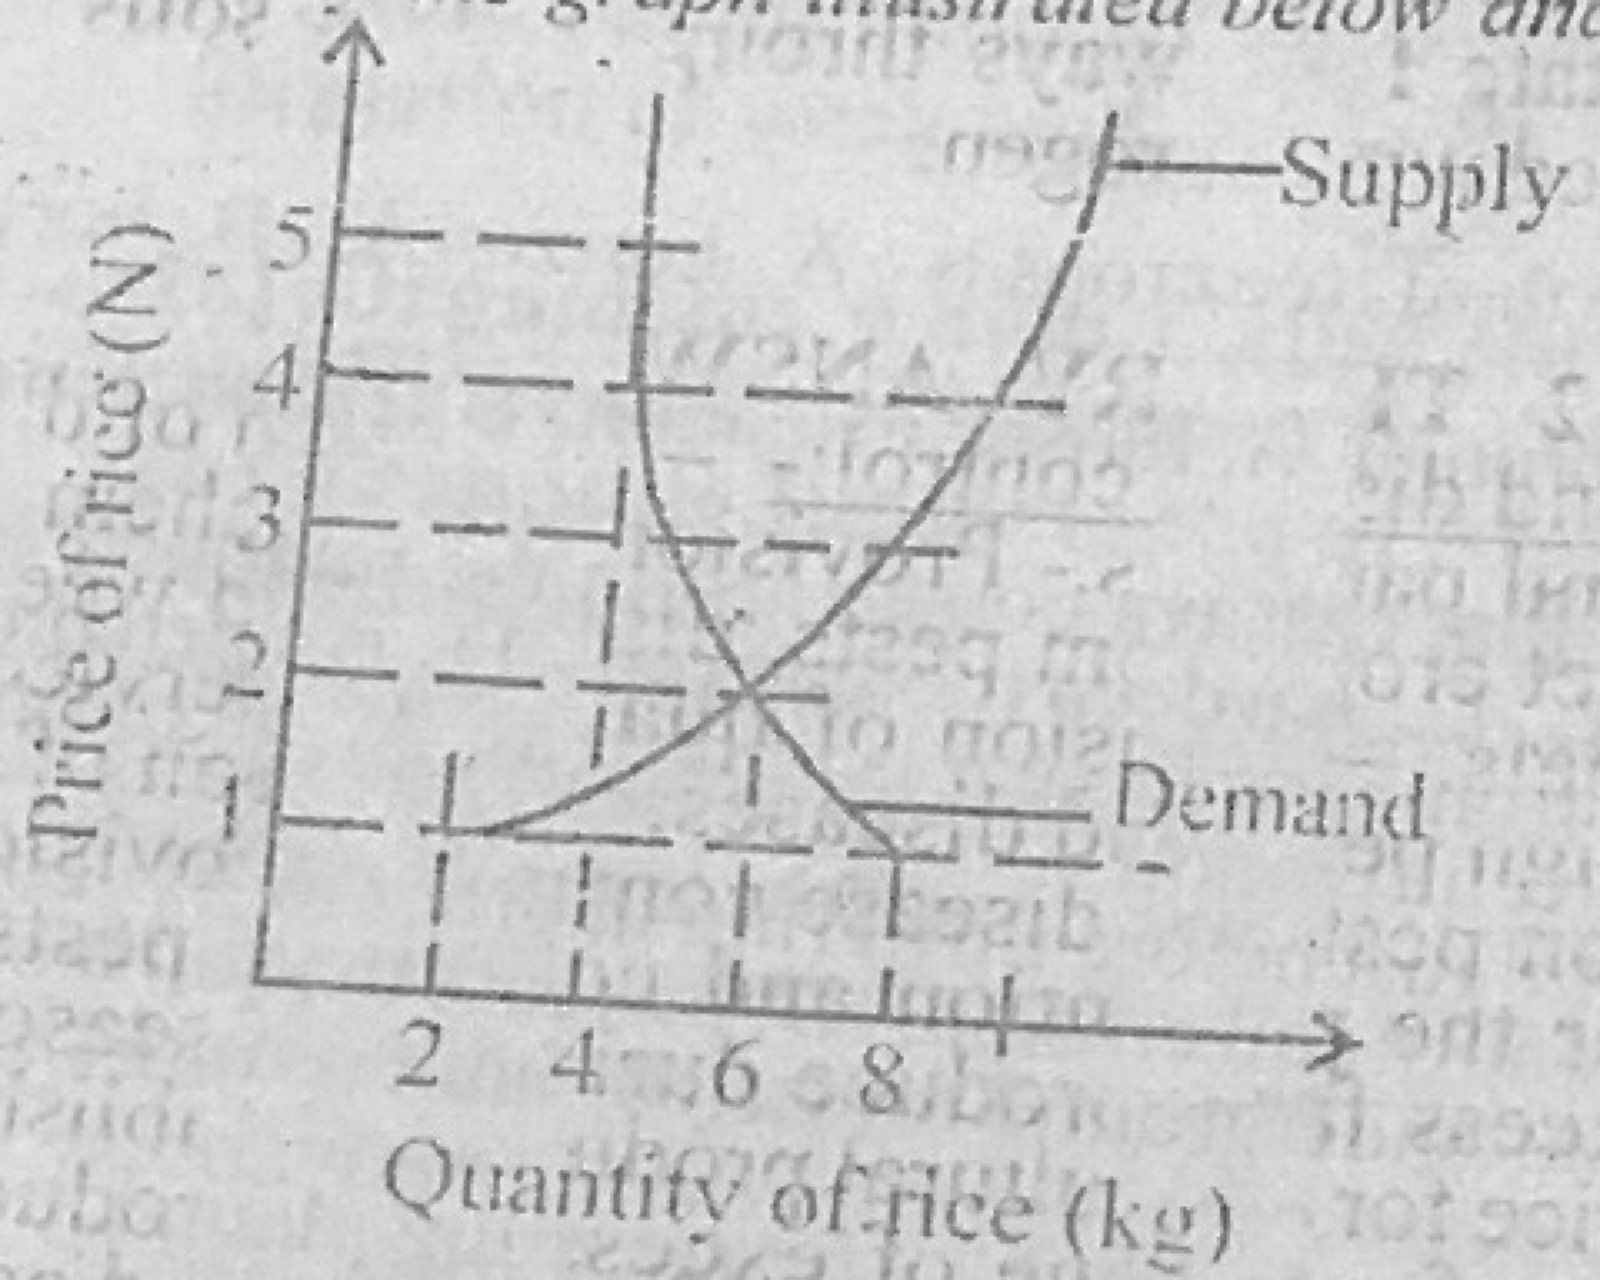
Basic Agricultural EconomicsStudy the graph illustrated below.
The graph best
- A.shows an increase in the supply of rice.
- B.describes a shift in the demand for rice.
- C.describes the equilibrium price for rice.
- D.shows that the demand for rice exceeds supply.
Show the answer and explanation
Answer: C (describes the equilibrium price for rice.)
Explanation
Where the demand and supply curves cross is the equilibrium point.