Question 40
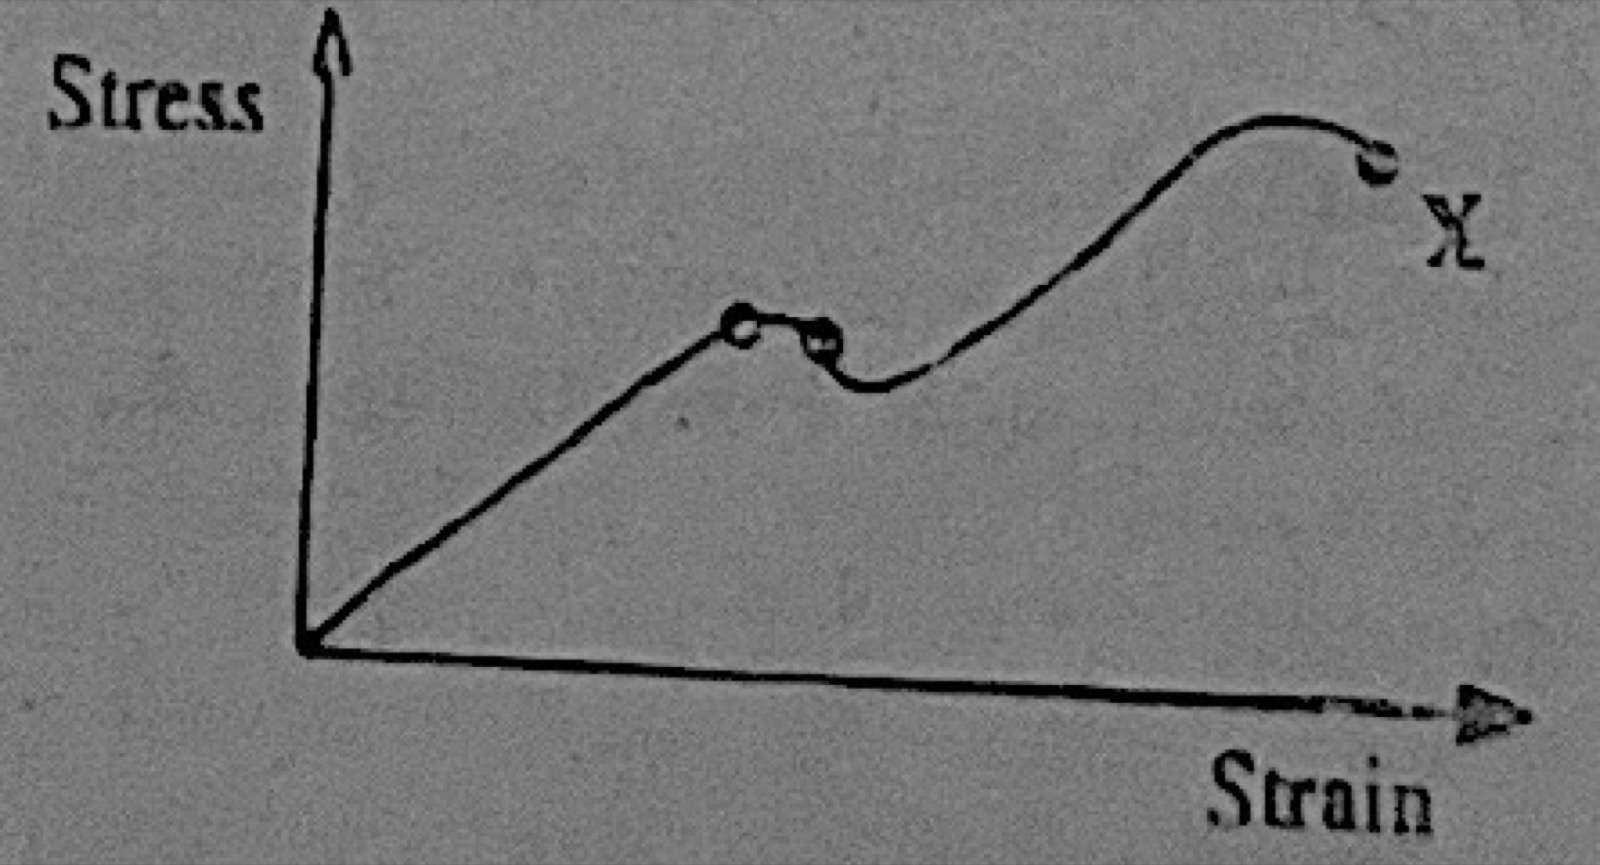
ElasticityThe diagram above represents the stress-strain graph for a typical metal rod. What does X represent?
- A.Yield point
- B.Breaking point
- C.Elastic limit
- D.Proportional limit
Show the answer and explanation
Answer: B (Breaking point)
Explanation
The straight part ends at the proportional/elastic limit and the small dip is the yield point. The curve stops at X, where the rod breaks, so X is the breaking point.