Question 7
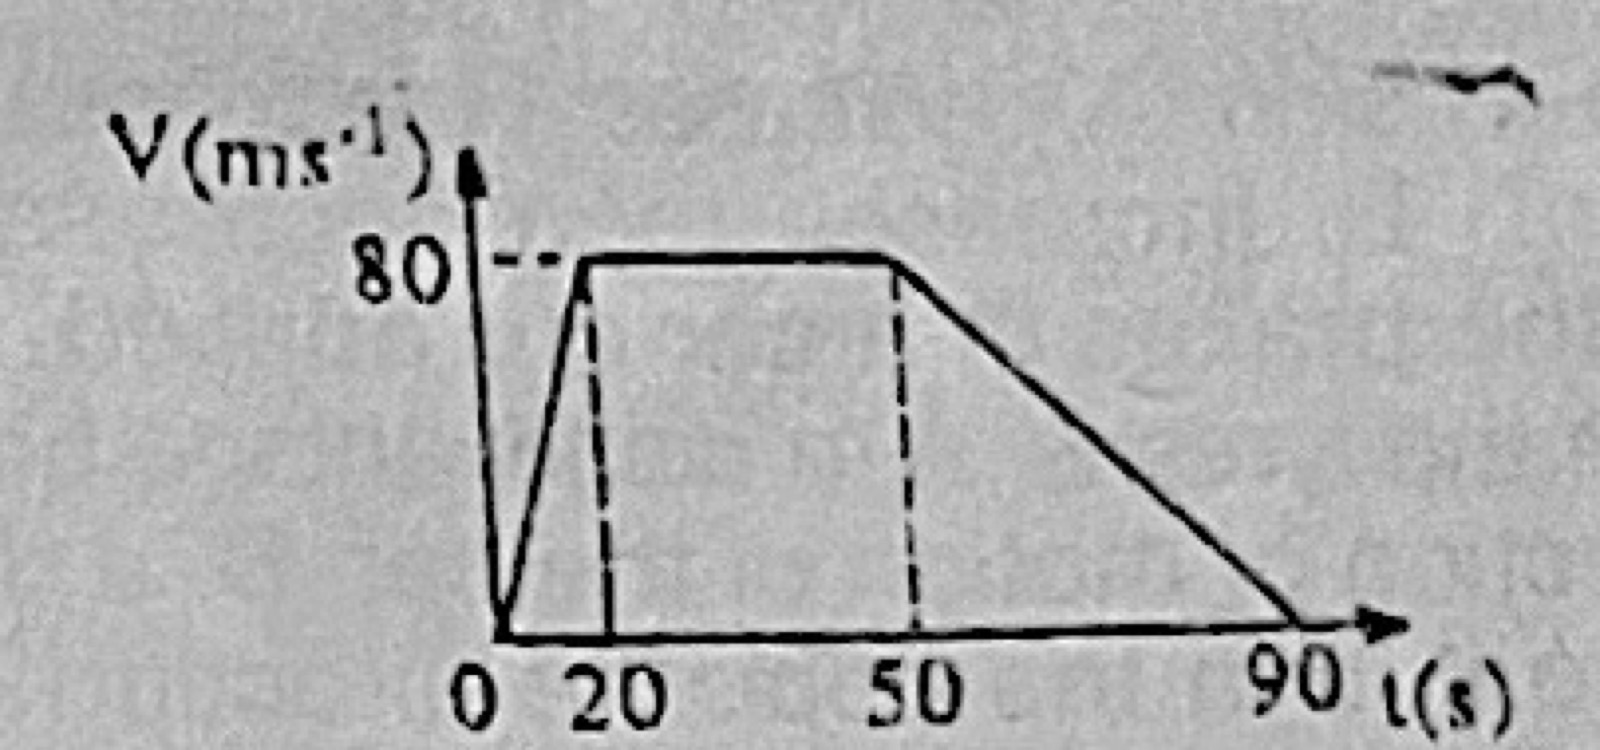
MotionThe diagram above shows the velocity time graph of a vehicle. Its acceleration and retardation respectively are
- A.8.0 m s−2, 4.0 m s−2
- B.4.0 m s−2, 8.0 m s−2
- C.4.0 m s−2, 2.0 m s−2
- D.2.0 m s−2, 4.0 m s−2
Show the answer and explanation
Answer: C (4.0 m s−2, 2.0 m s−2)
Explanation
Acceleration = 80/20 = 4.0 m s−2 (0 to 20 s). Retardation = 80/(90 − 50) = 2.0 m s−2.