Question 26
Gas LawsWhich of the following graphs represents the variation of pressure P against volume V at constant temperature?
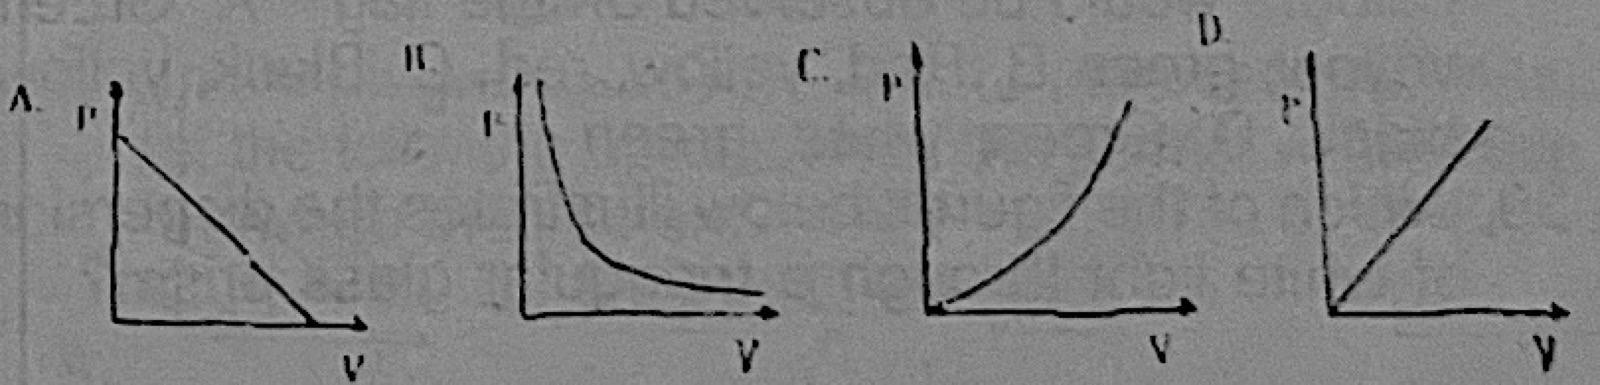
- A.Graph A
- B.Graph B
- C.Graph C
- D.Graph D
Show the answer and explanation
Answer: B (Graph B)
Explanation
Boyle's law: PV = constant, so P falls as V rises along a curve (hyperbola) that never touches the axes, as in graph B.