Question 24
SoundThe fundamental frequency of vibration (f) of a wire is measured as a function of the tension (T) in the wire. Which of the following curves adequately represents the data?
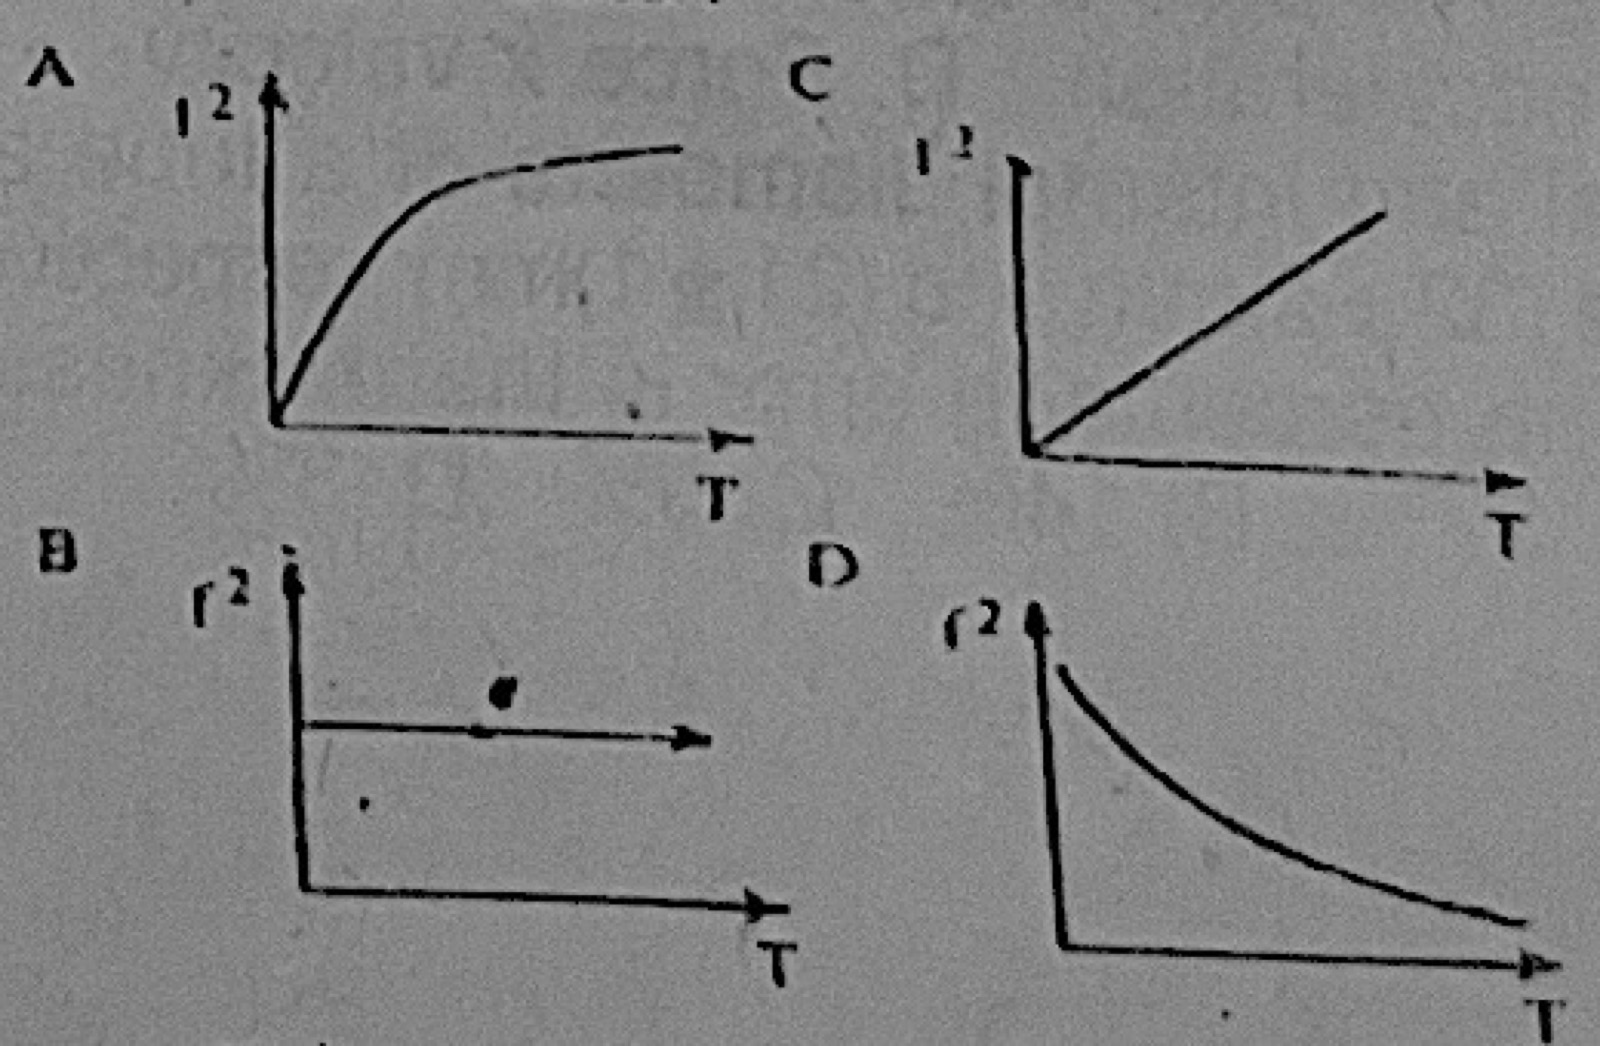
- A.Graph A
- B.Graph B
- C.Graph C
- D.Graph D
Show the answer and explanation
Answer: C (Graph C)
Explanation
f ∝ √T, so f2 ∝ T: a graph of f2 against T is a straight line through the origin, as in graph C.