Question 18
Change of State and VapoursA block of ice at 0°C is put in an open vessel and heated uniformly until half the water boils off. Which of the following graphs best illustrates the change in temperature during the process?
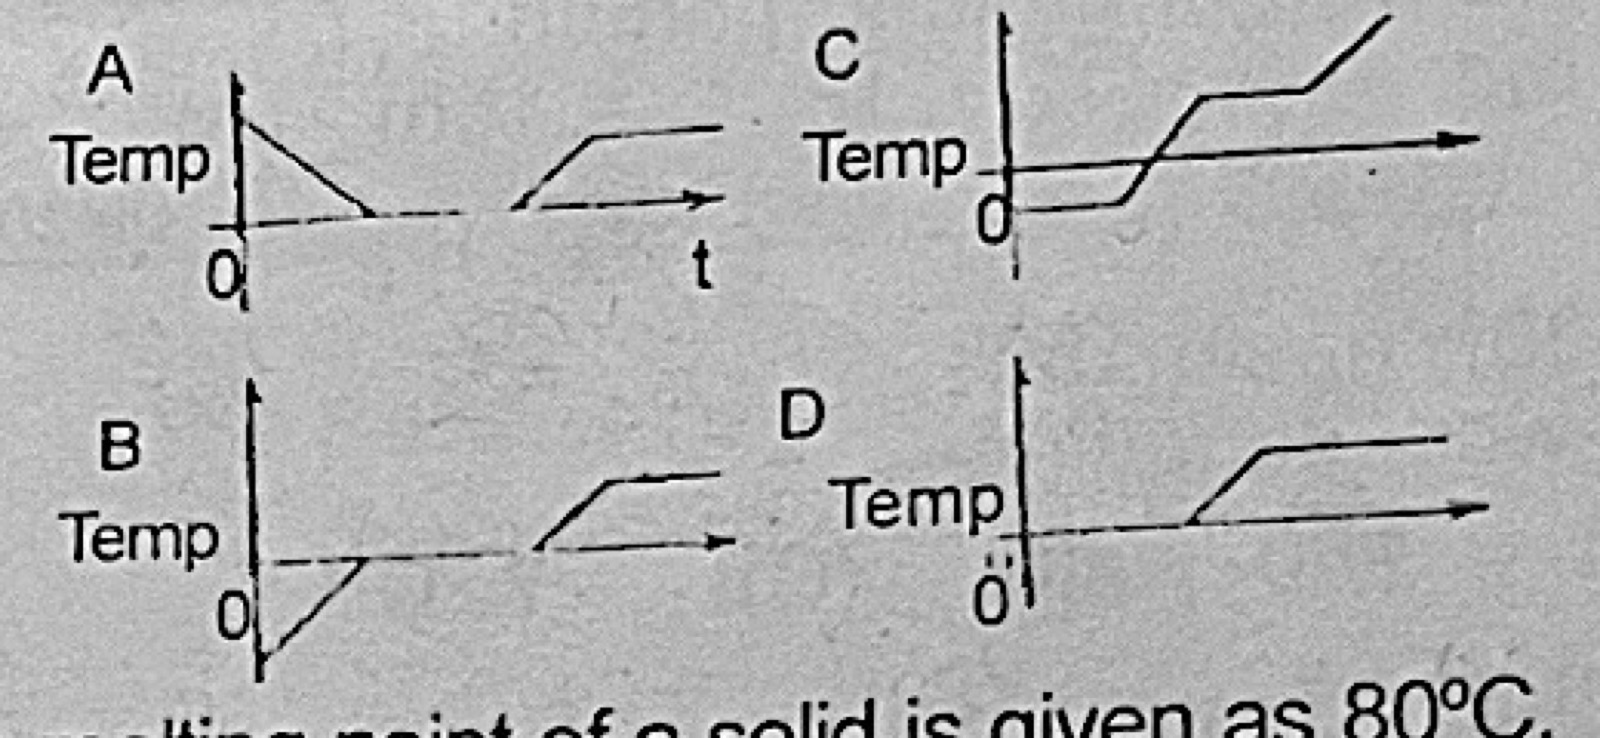
- A.Graph A
- B.Graph B
- C.Graph C
- D.Graph D
Show the answer and explanation
Answer: D (Graph D)
Explanation
The temperature stays at 0°C while the ice melts, rises steadily as the water warms, then stays at 100°C while the water boils; graph D shows flat, rising, flat.