Question 47
Radioactivity and Nuclear PhysicsWhich of the following graphs correctly illustrates the number of remaining atoms during a radioactive decay?
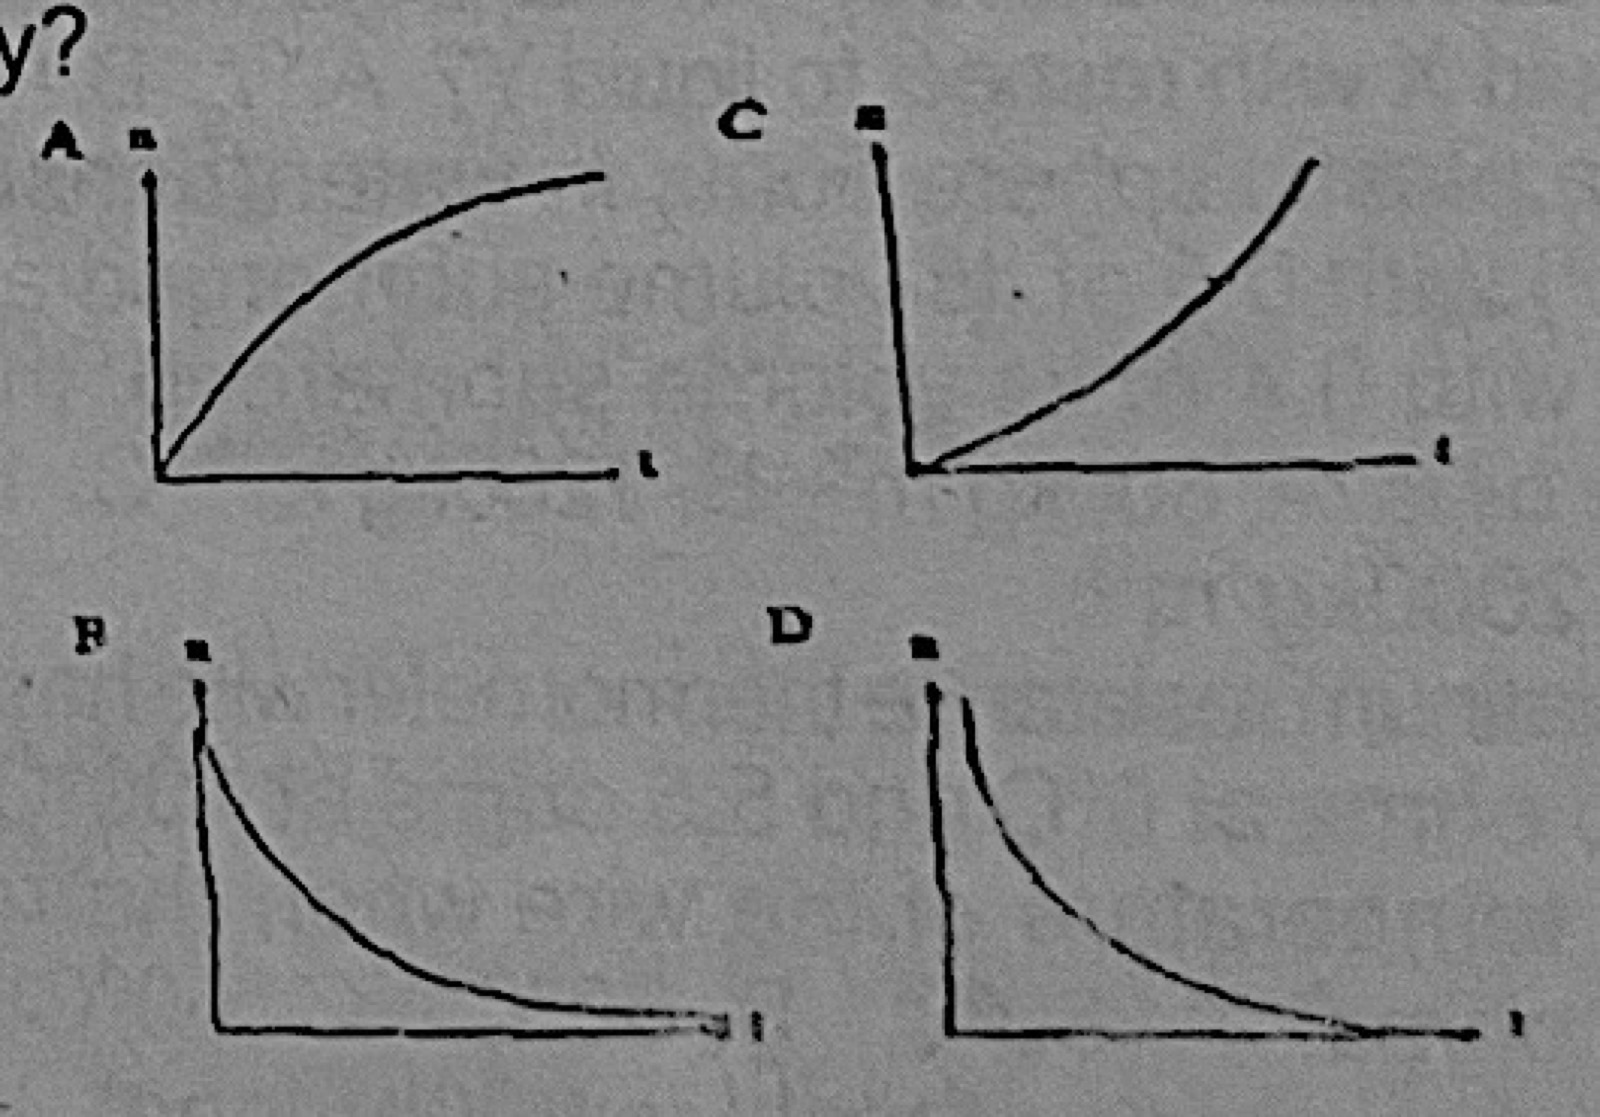
- A.Graph A
- B.Graph B
- C.Graph C
- D.Graph D
Show the answer and explanation
Answer: B (Graph B)
Explanation
The number of undecayed atoms starts at its largest value and falls exponentially, halving every half-life and approaching zero; graph B shows this curve starting from the initial number.