Question 18
Gas LawsThe graphs below show the variation of volume (V) against temperature (T) in Kelvin for a given mass of gas at constant pressure. Which of the graphs depicts the behaviour of an ideal gas?
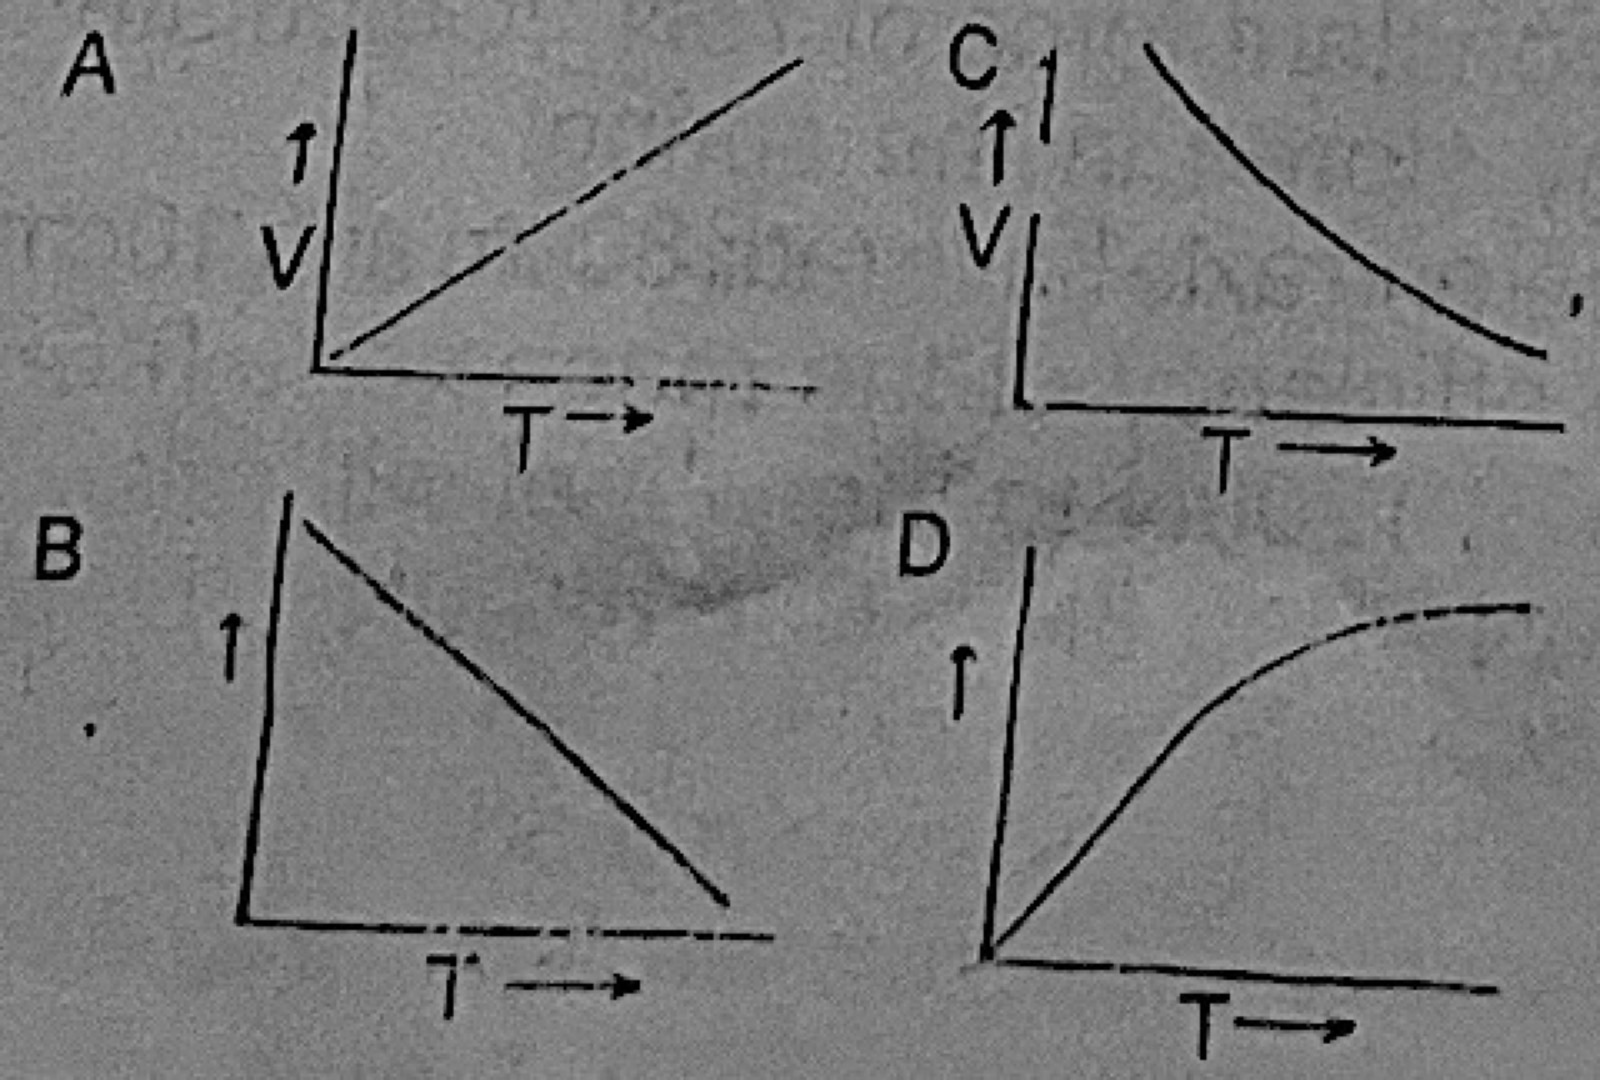
- A.A
- B.B
- C.C
- D.D
Show the answer and explanation
Answer: A (A)
Explanation
Charles' law: at constant pressure V is proportional to the kelvin temperature, a straight line through the origin, as in A.