Question 49
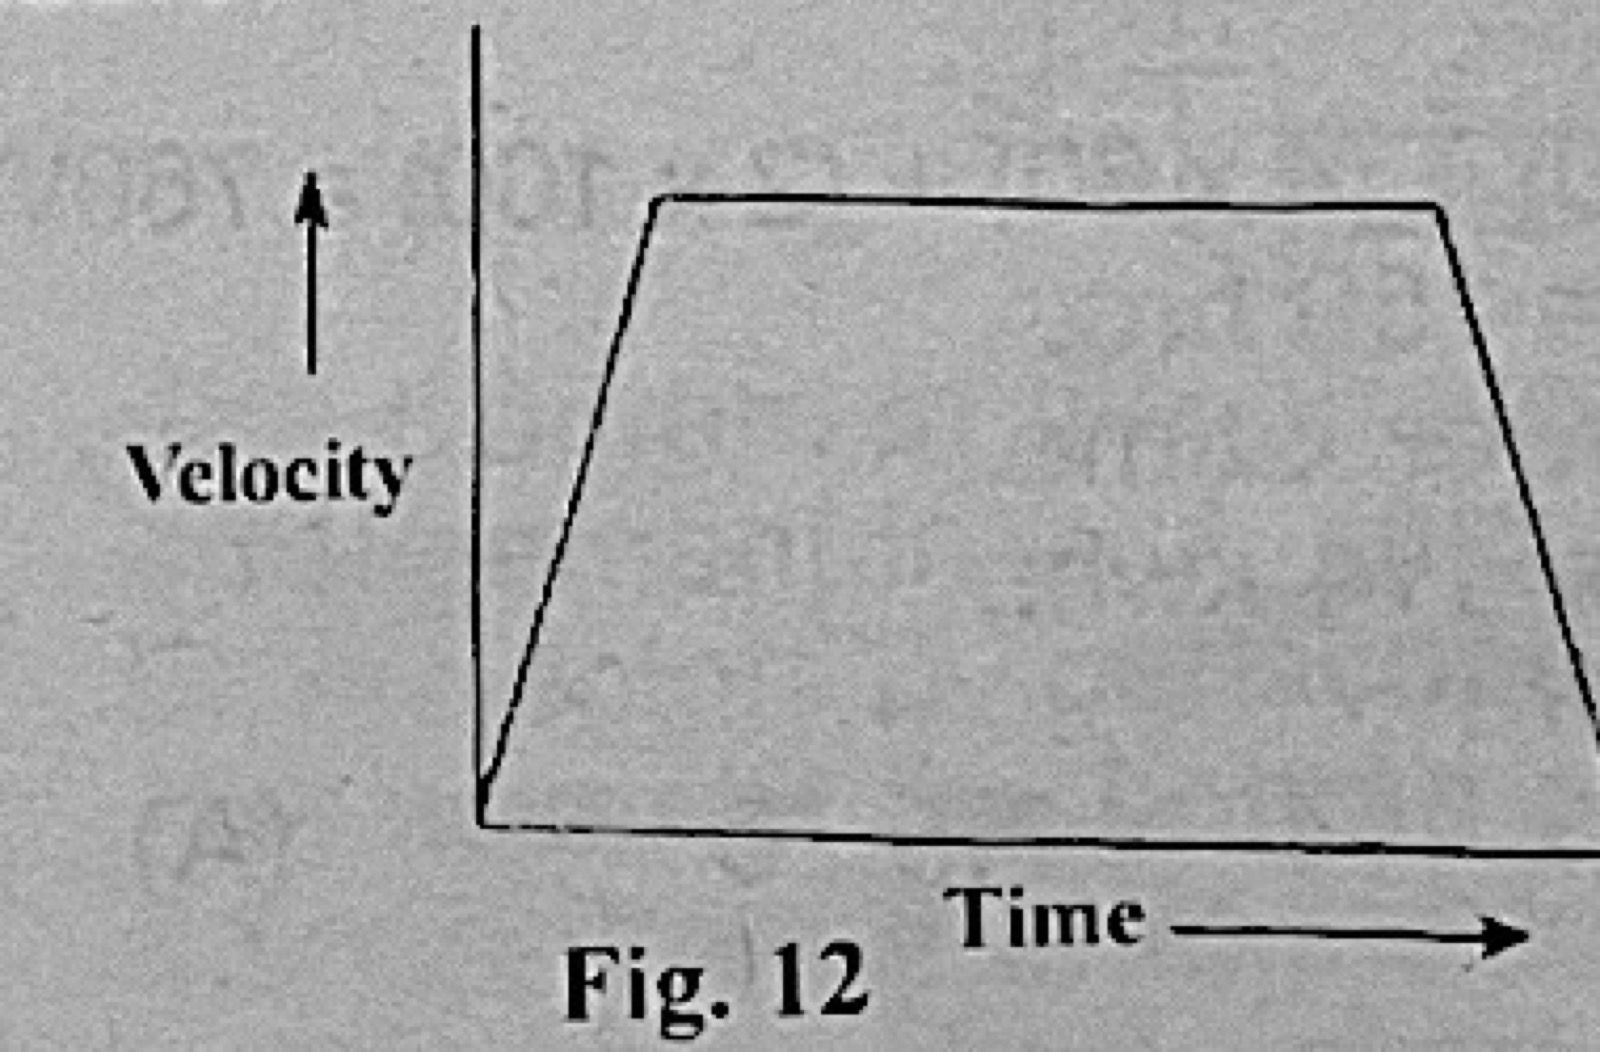
MotionFig. 12 shows the velocity-time graph of a car which starts from rest and is accelerated uniformly at the rate of 3 m sec−2 for 5 seconds. It attains a velocity which is maintained for 1 minute. The car is then brought to rest by a uniform retardation after another 3 seconds. Calculate the total distance covered.
- A.900 metres
- B.1920 metres
- C.1020 metres
- D.960 metres
- E.860 metres.
Show the answer and explanation
Answer: D (960 metres)
Explanation
Top speed = 3 × 5 = 15 m s−1. Distance = area under the graph = ½ × 5 × 15 + 15 × 60 + ½ × 3 × 15 = 37.5 + 900 + 22.5 = 960 m.