Question 42
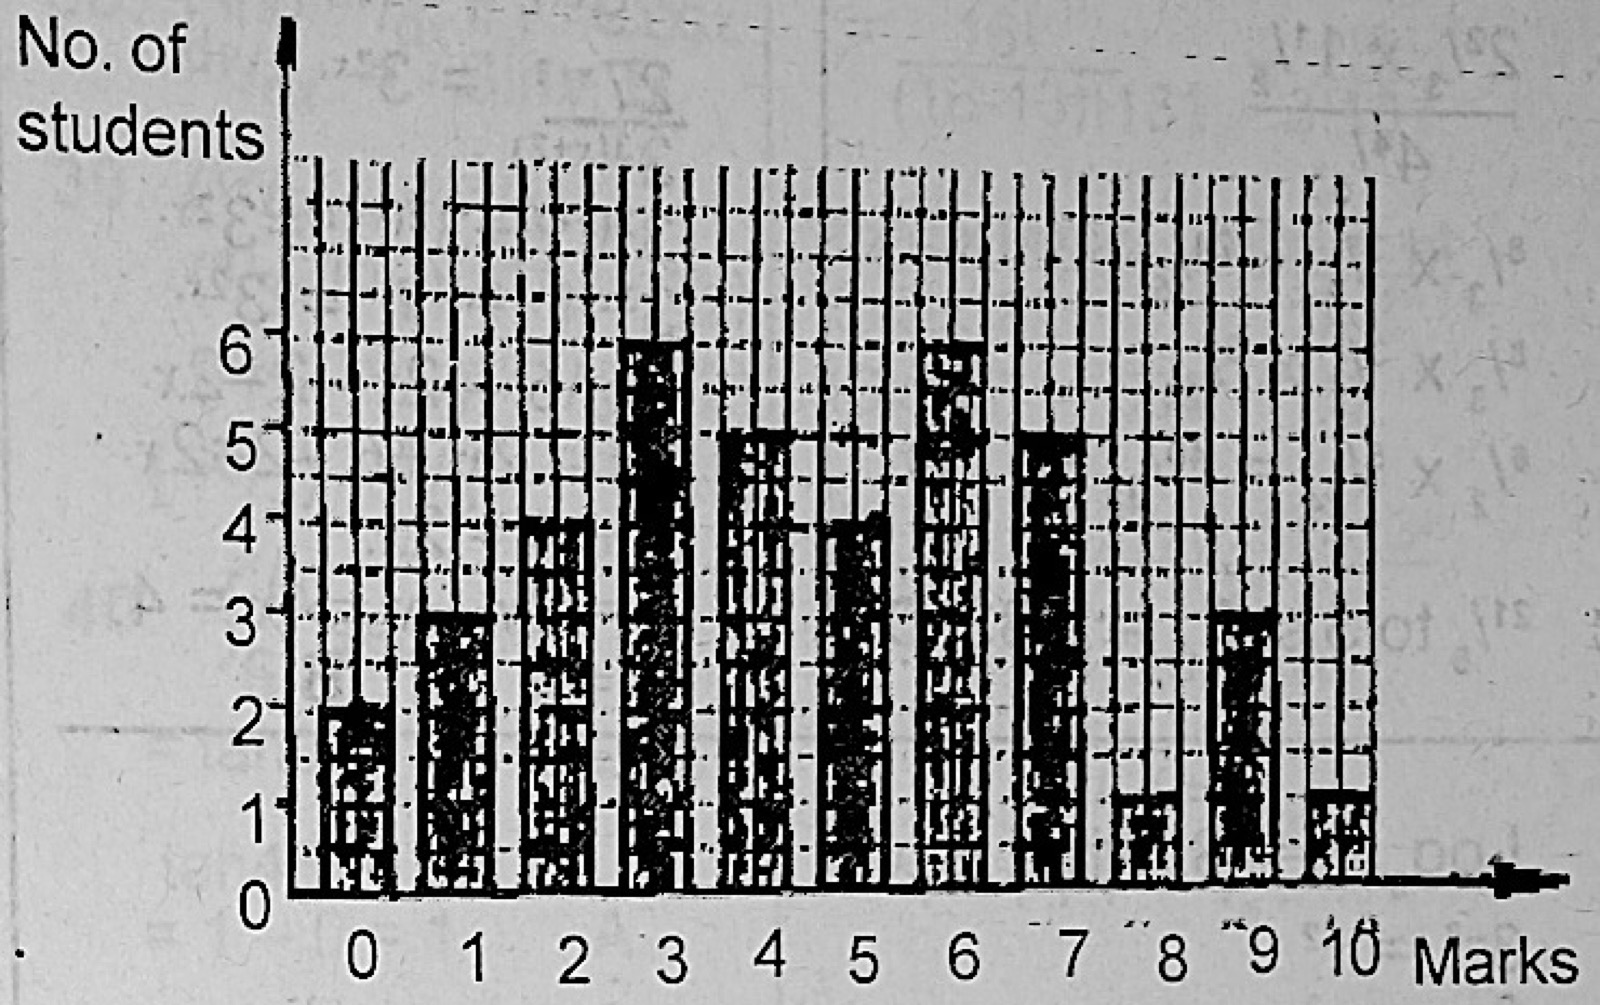
Data PresentationThe bar chart above shows the distribution of marks in a class test. If the pass mark is 5, what percentage of the students failed the test?
- A.10%
- B.20%
- C.50%
- D.60%
Show the answer and explanation
Answer: C (50%)
Explanation
The bars total 40 students. Those scoring below 5 (marks 0 to 4) number 2 + 3 + 4 + 6 + 5 = 20, which is 50%.