Question 42
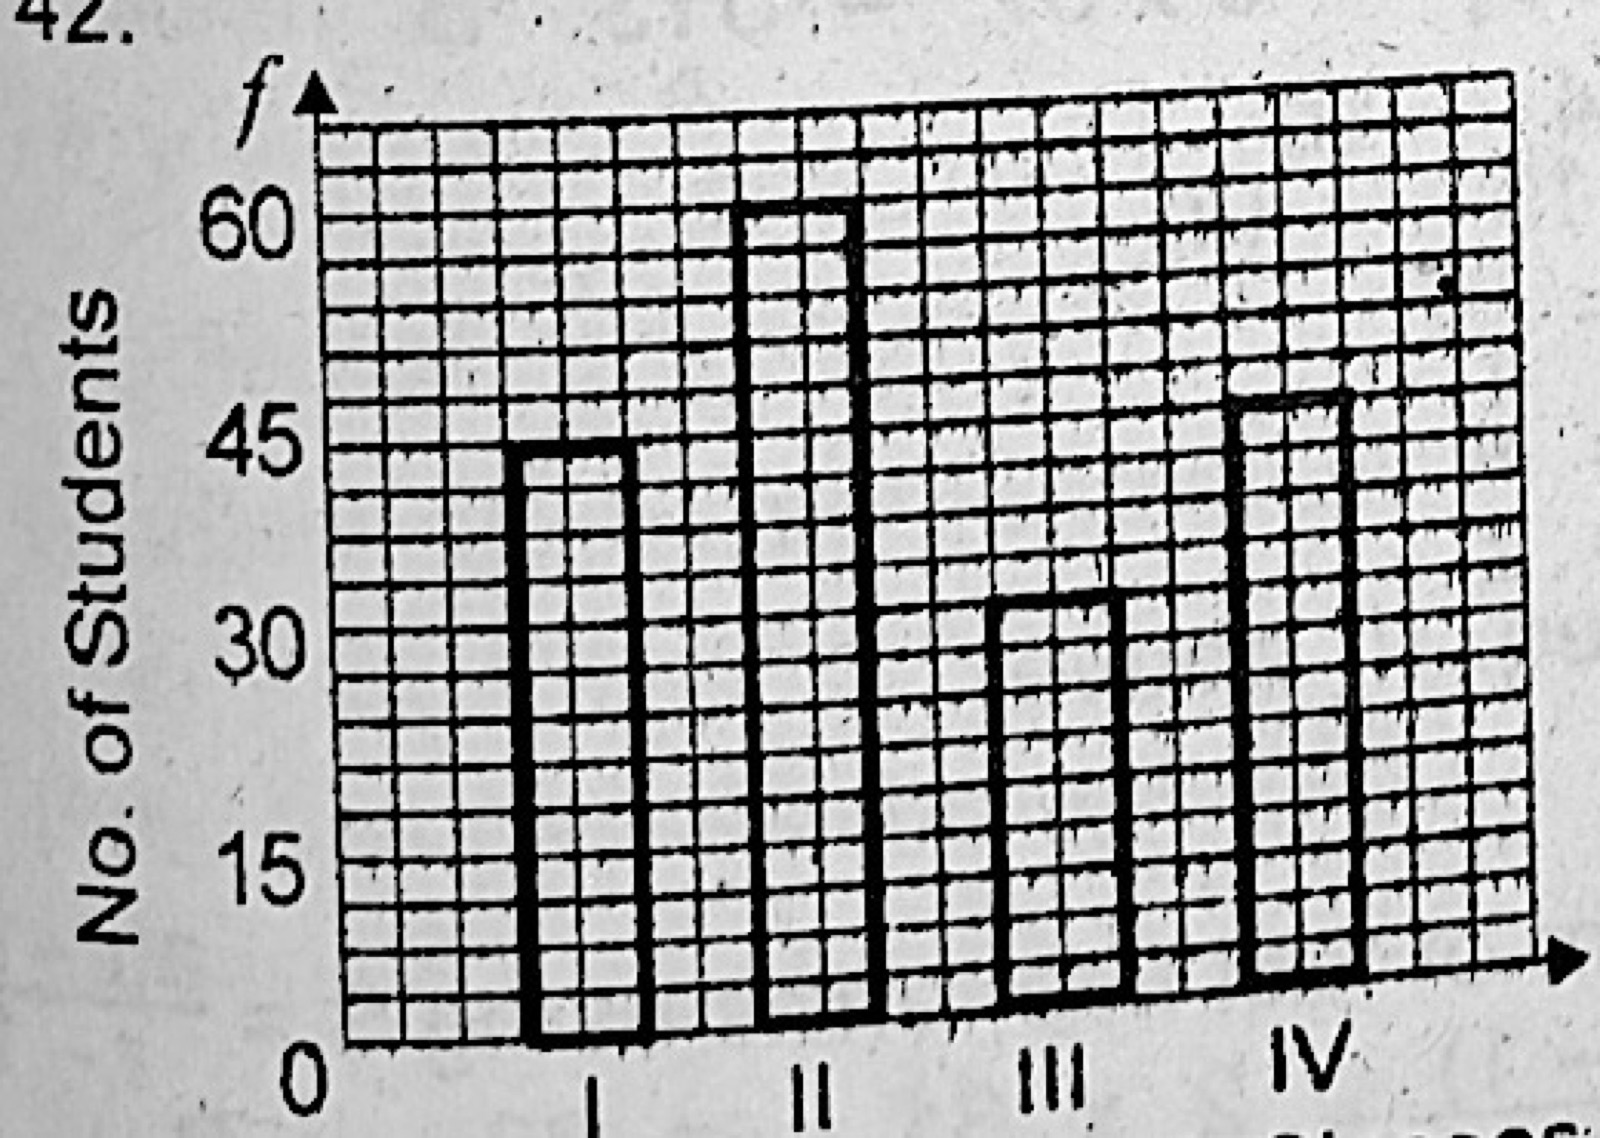
Data PresentationThe bar chart above shows the distribution of SS2 students in a school. Find the total number of students.
- A.180
- B.135
- C.210
- D.105
Show the answer and explanation
Answer: A (180)
Explanation
Reading the bars: about 45 + 60 + 30 + 45 = 180 students.