Question 18
InequalitiesWhich of the following diagrams represents the solution of the inequalities y ≤ x − 2 and y ≥ x2 − 4?
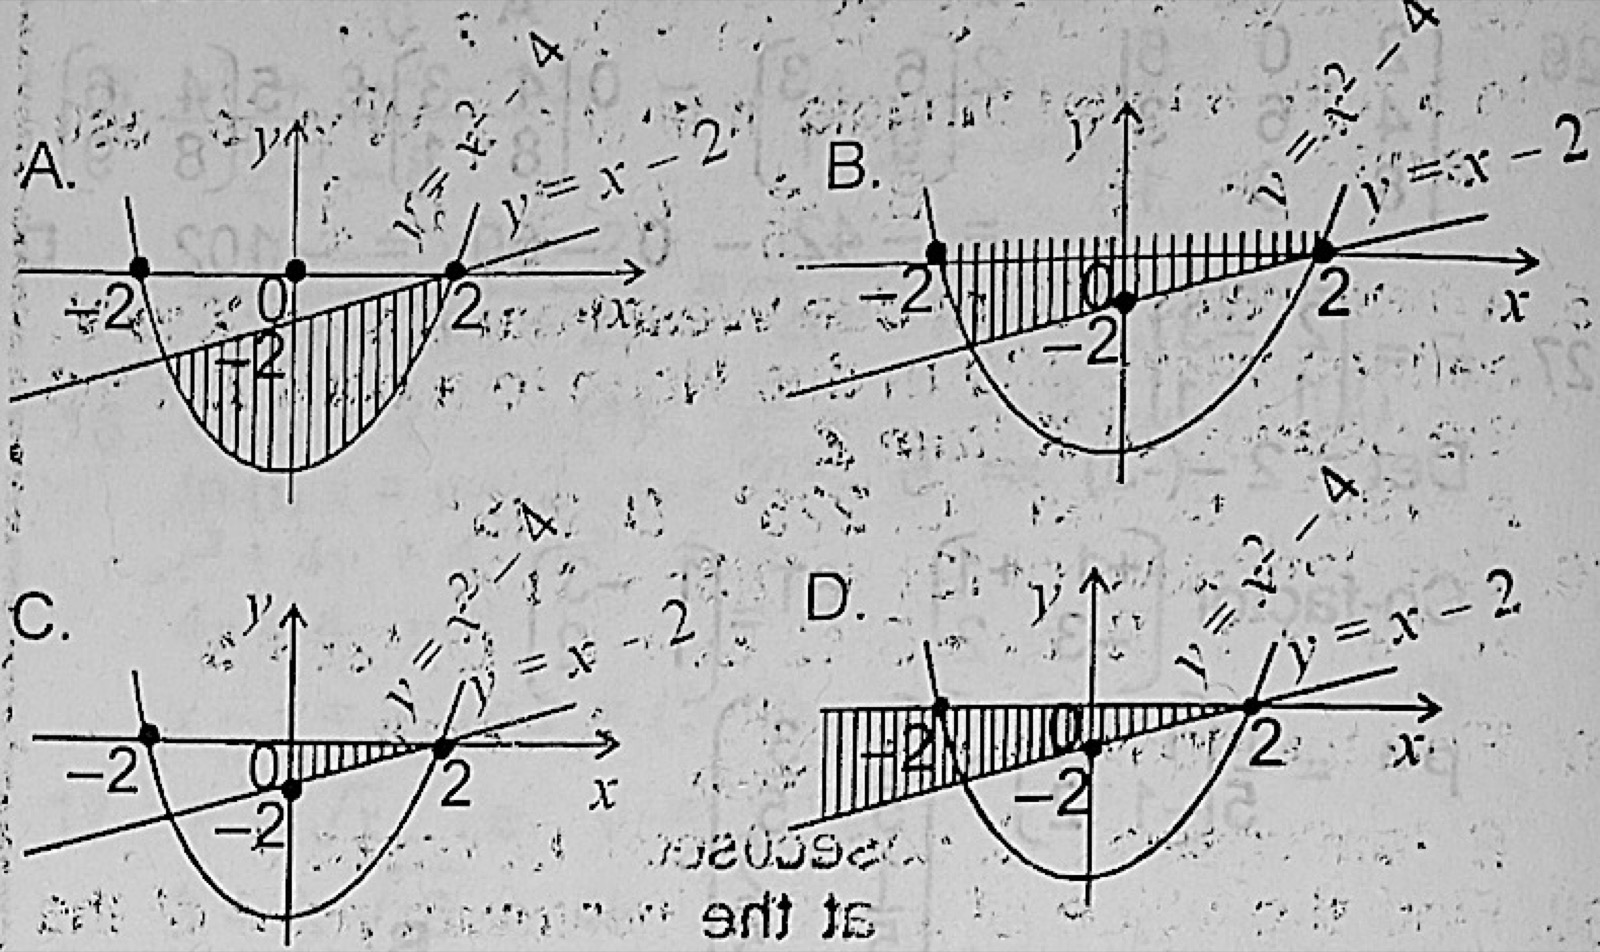
- A.Diagram A
- B.Diagram B
- C.Diagram C
- D.Diagram D
Show the answer and explanation
Answer: A (Diagram A)
Explanation
The points must be on or below the line y = x − 2 and on or above the parabola y = x2 − 4. That is the region inside the parabola's bowl and under the line, between x = −1 and x = 2, which is shaded in A.