Question 5
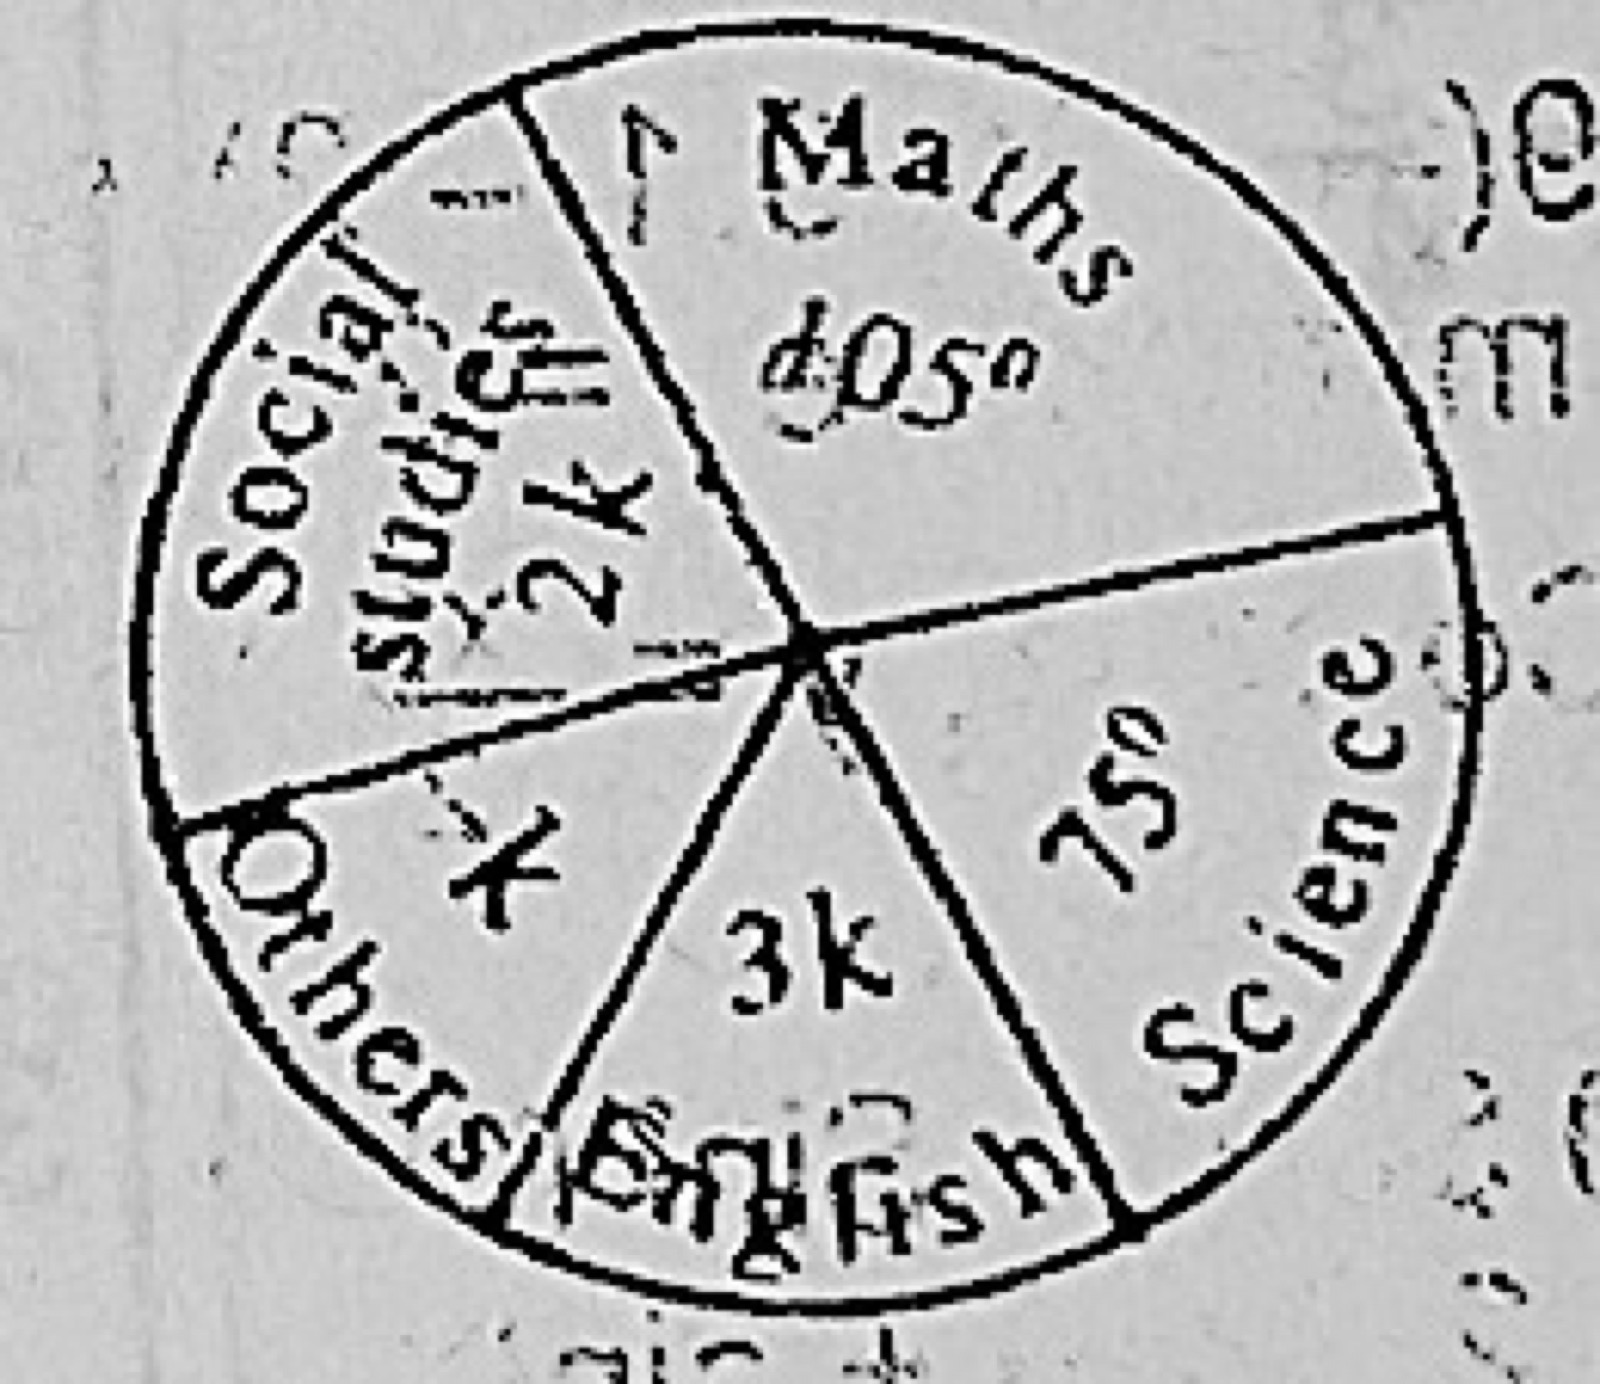
Data PresentationThe pie chart above illustrates the amount of private time a student spends in a week studying various subjects. Find the value of k.
- A.90°
- B.60°
- C.30°
- D.15°
Show the answer and explanation
Answer: C (30°)
Explanation
105° + 75° + 2k + k + 3k = 360°, so 6k = 180° and k = 30°.