Question 3
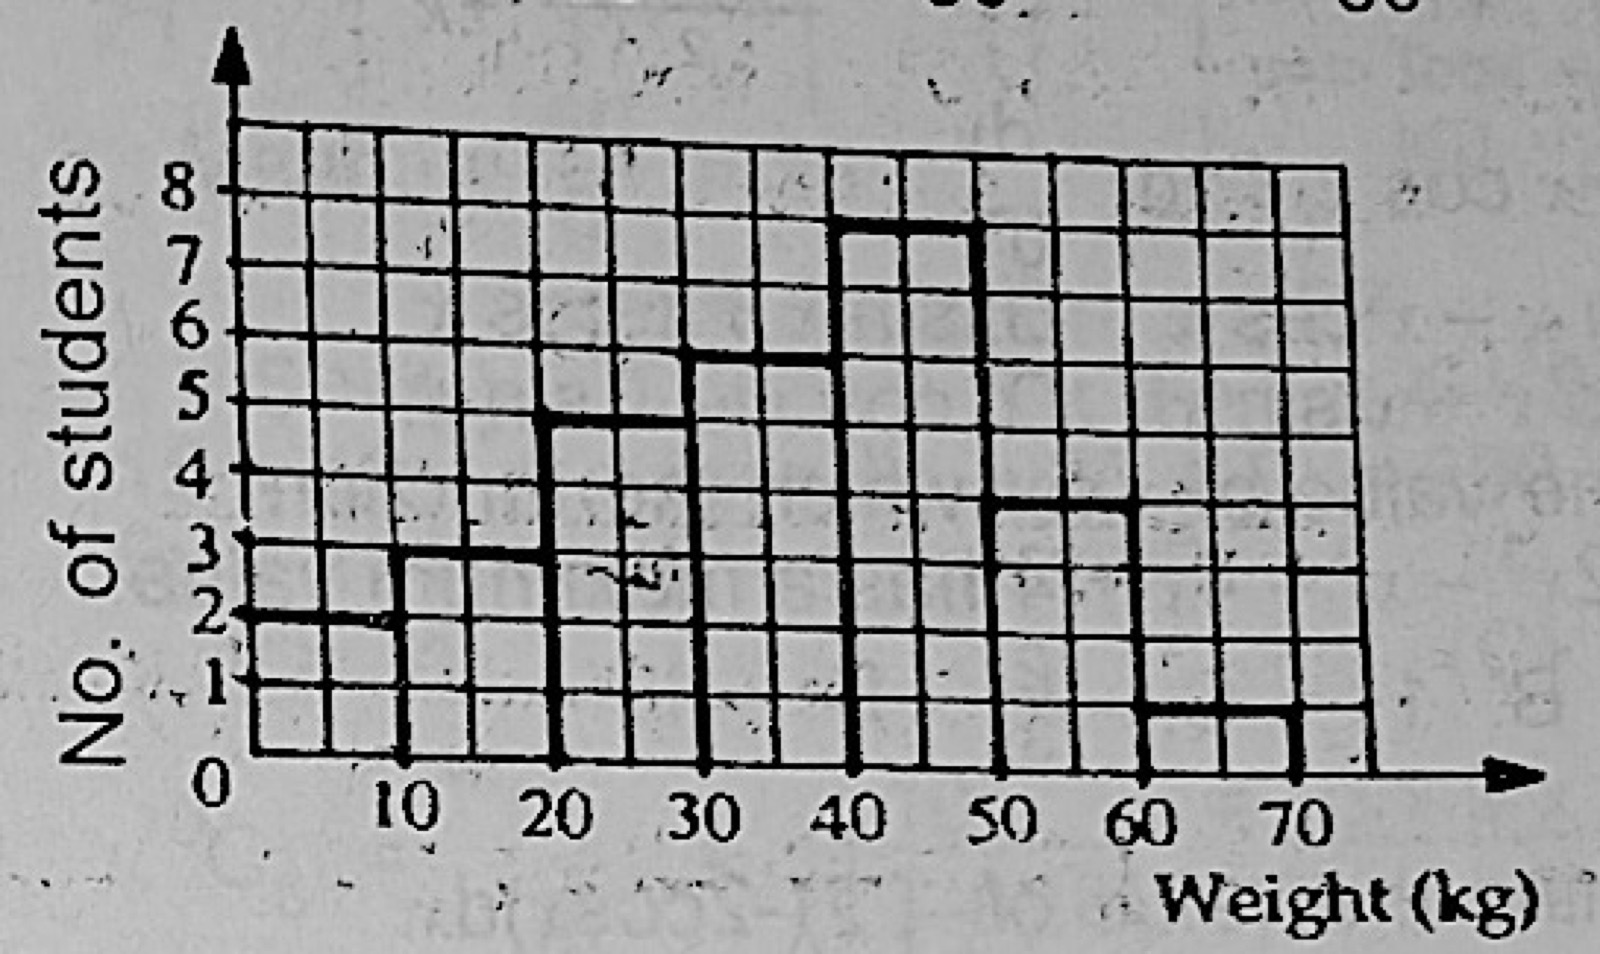
Data PresentationThe histogram above represents the weights of students who travelled out of their school for an examination. How many people made the trip?
- A.78
- B.38
- C.29
- D.69
Show the answer and explanation
Answer: C (29)
Explanation
Add the bar heights: 2 + 3 + 5 + 6 + 8 + 4 + 1 = 29.