Question 18
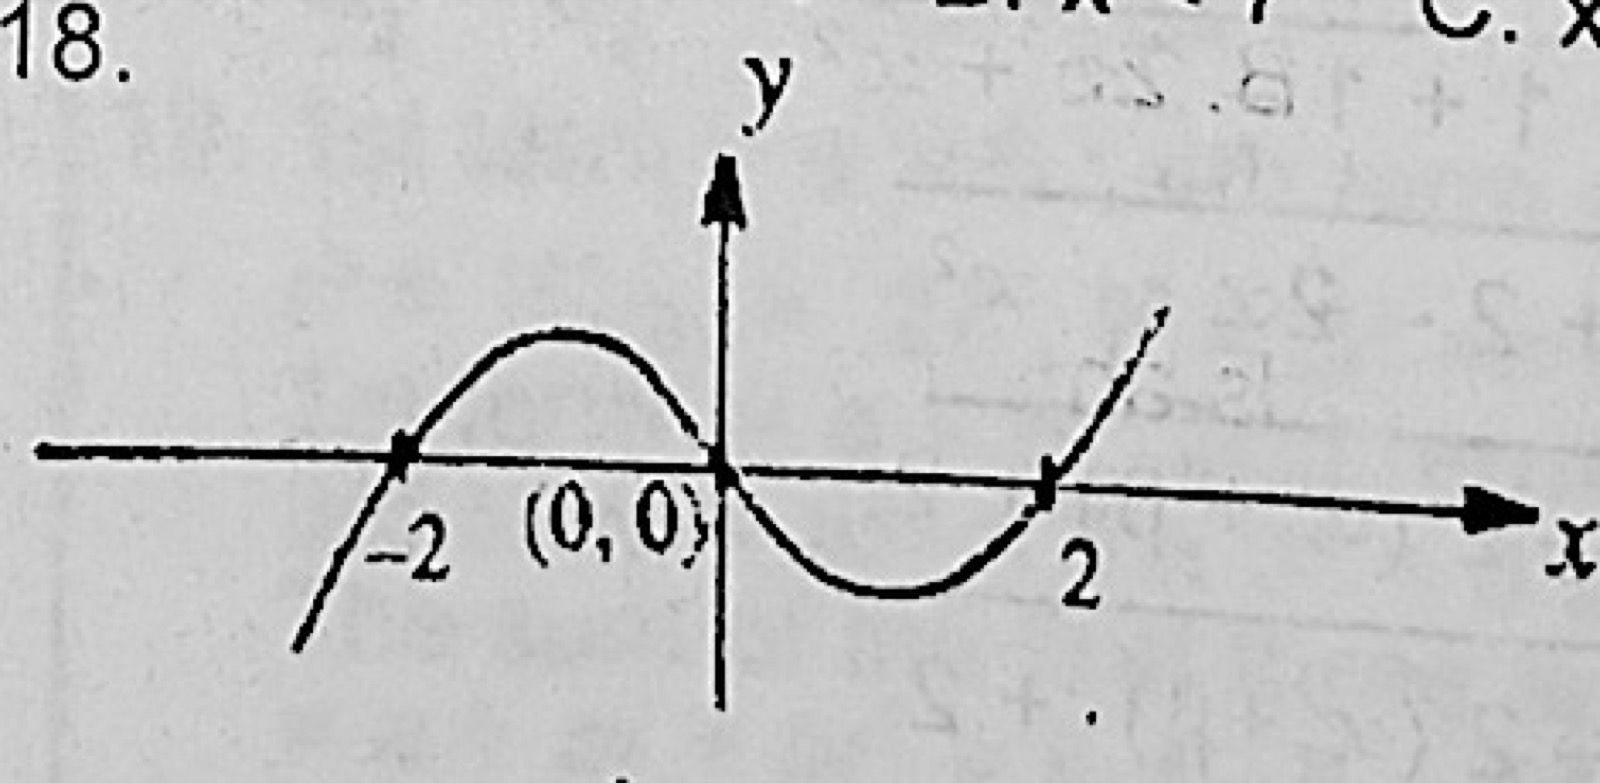
InequalitiesThe diagram above is the graph of the function f(x). Determine the range of values of x for which f(x) ≤ 0.
- A.x ≤ 2
- B.0 ≤ x ≤ 2
- C.−2 ≤ x ≤ 0, x ≥ 2
- D.x ≤ −2, 0 ≤ x ≤ 2
Show the answer and explanation
Answer: D (x ≤ −2, 0 ≤ x ≤ 2)
Explanation
The curve is on or below the x-axis to the left of −2 and between 0 and 2, so f(x) ≤ 0 for x ≤ −2 and 0 ≤ x ≤ 2.