Question 49
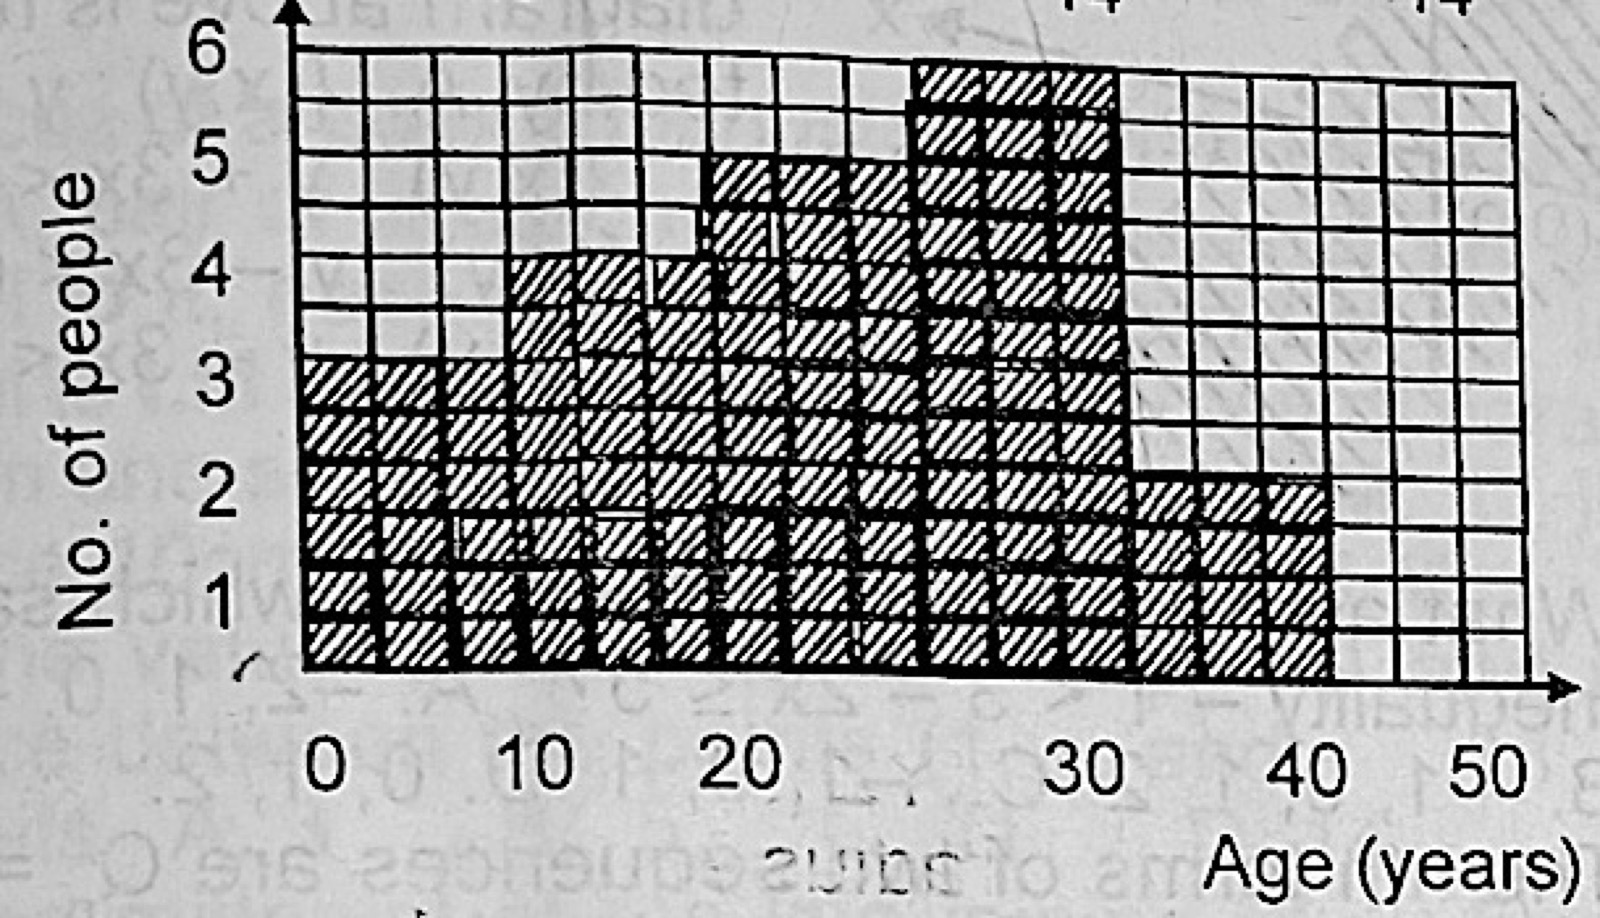
Data PresentationThe histogram above shows the ages of the victims of a pollution. How many people were involved in the pollution?
- A.15
- B.18
- C.20
- D.21
Show the answer and explanation
Answer: C (20)
Explanation
Add the heights of the bars: 3 + 4 + 5 + 6 + 2 = 20 people.