Question 46
Measures of DispersionThe graph above shows the cumulative frequency of the distribution of masses of fertilizer for 48 workers in one institution. Which of the following gives the interquartile range?
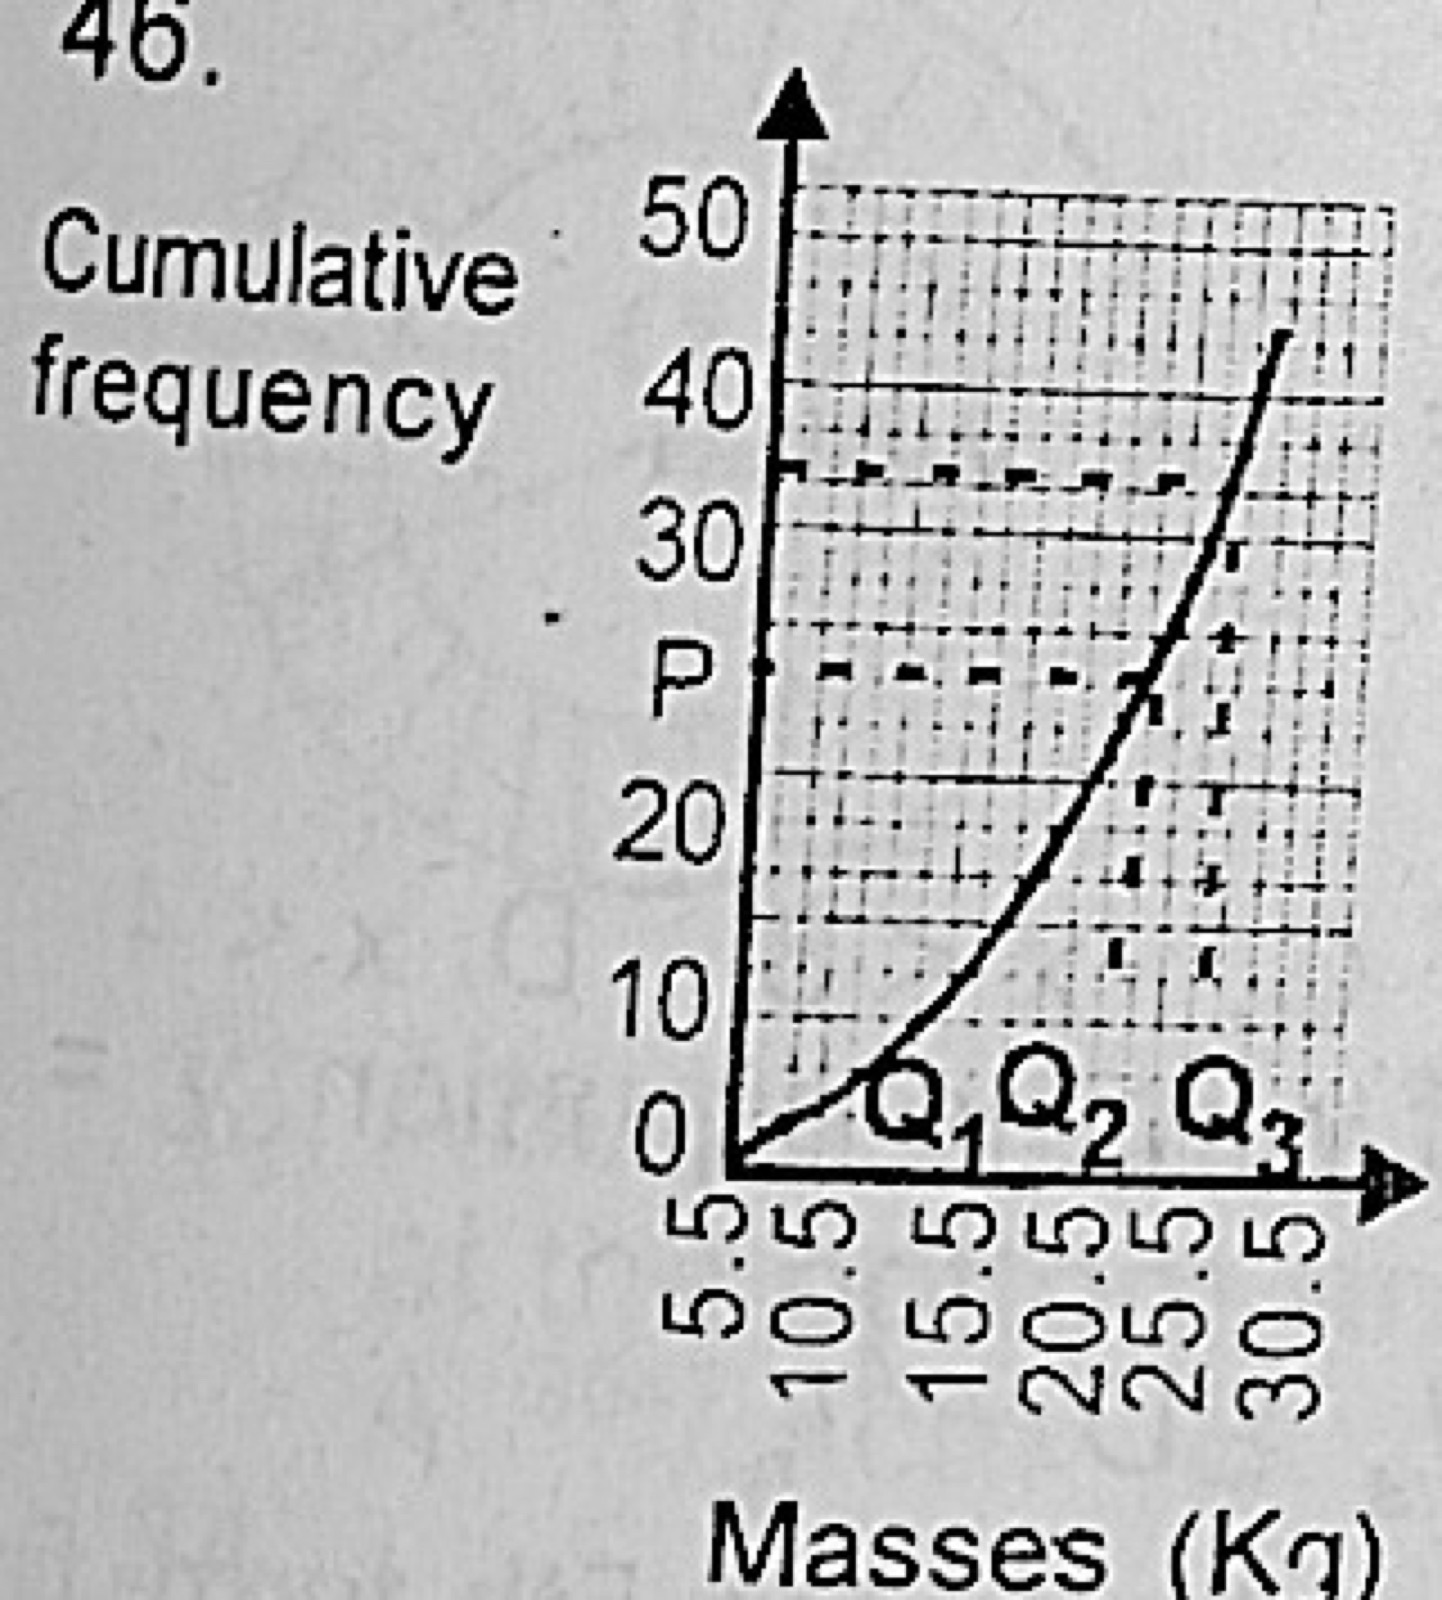
- A.Q3 − Q1
- B.Q3 − Q2
- C.Q2 − Q1
- D.½(Q3 − Q1)
Show the answer and explanation
Answer: A (Q3 − Q1)
Explanation
The interquartile range is the upper quartile minus the lower quartile, Q3 − Q1. Half of it would be the semi-interquartile range.