Question 44
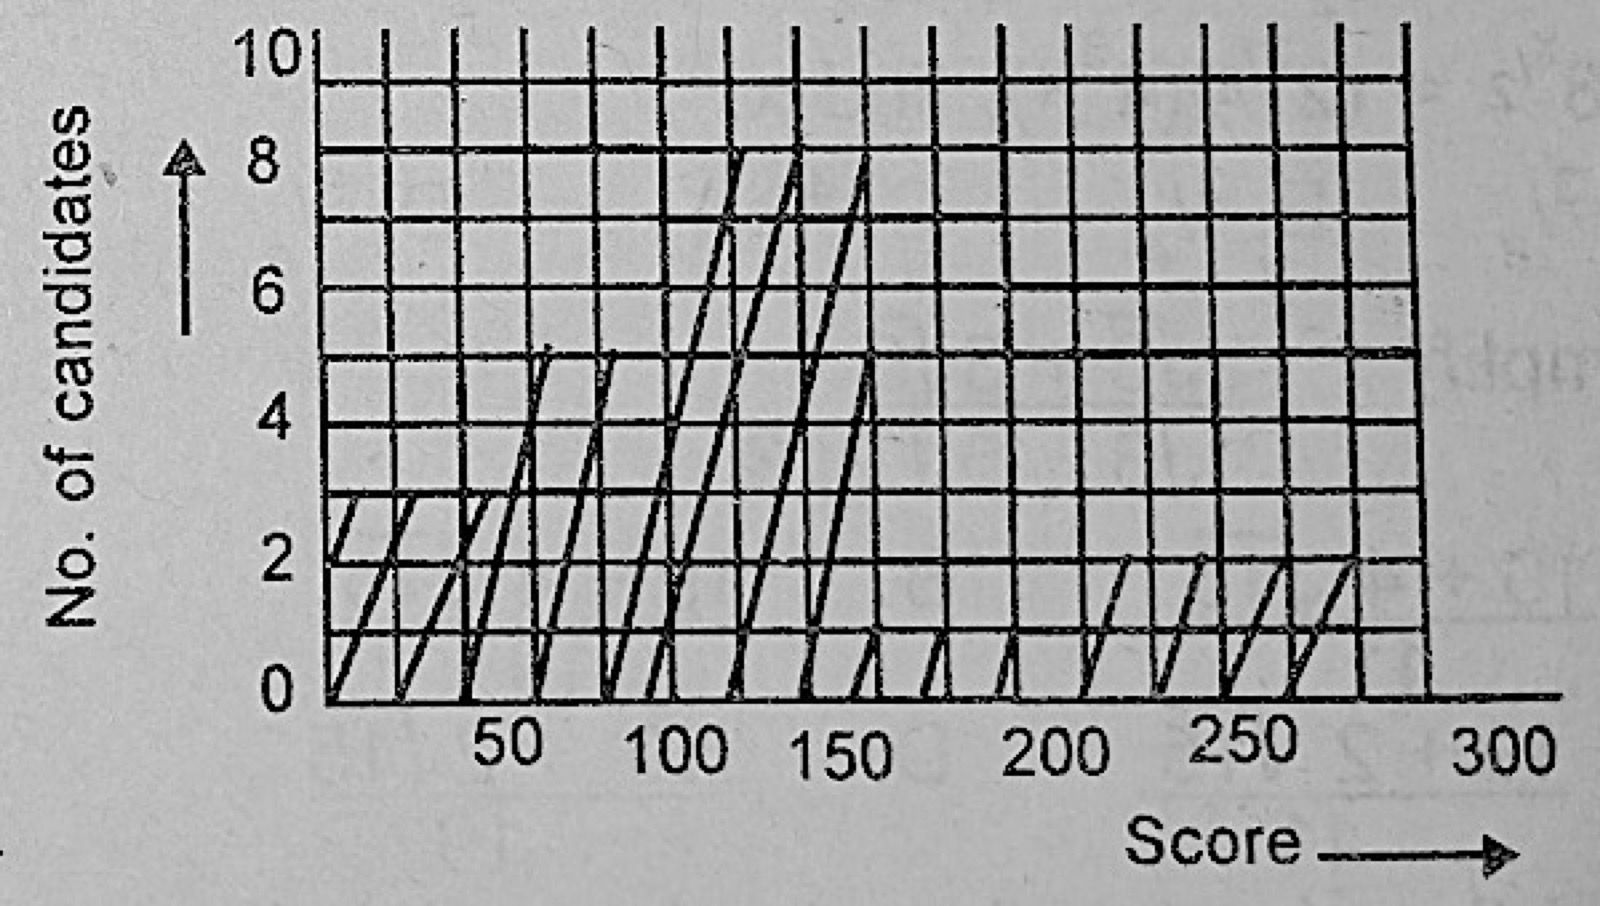
Data PresentationIn an examination, the result of a certain school is as shown in the histogram above. How many candidates did the school present?
- A.12
- B.16
- C.18
- D.19
Show the answer and explanation
Answer: D (19)
Explanation
Add the frequencies (heights) of the bars: 3 + 5 + 8 + 1 + 2 = 19.