Question 20
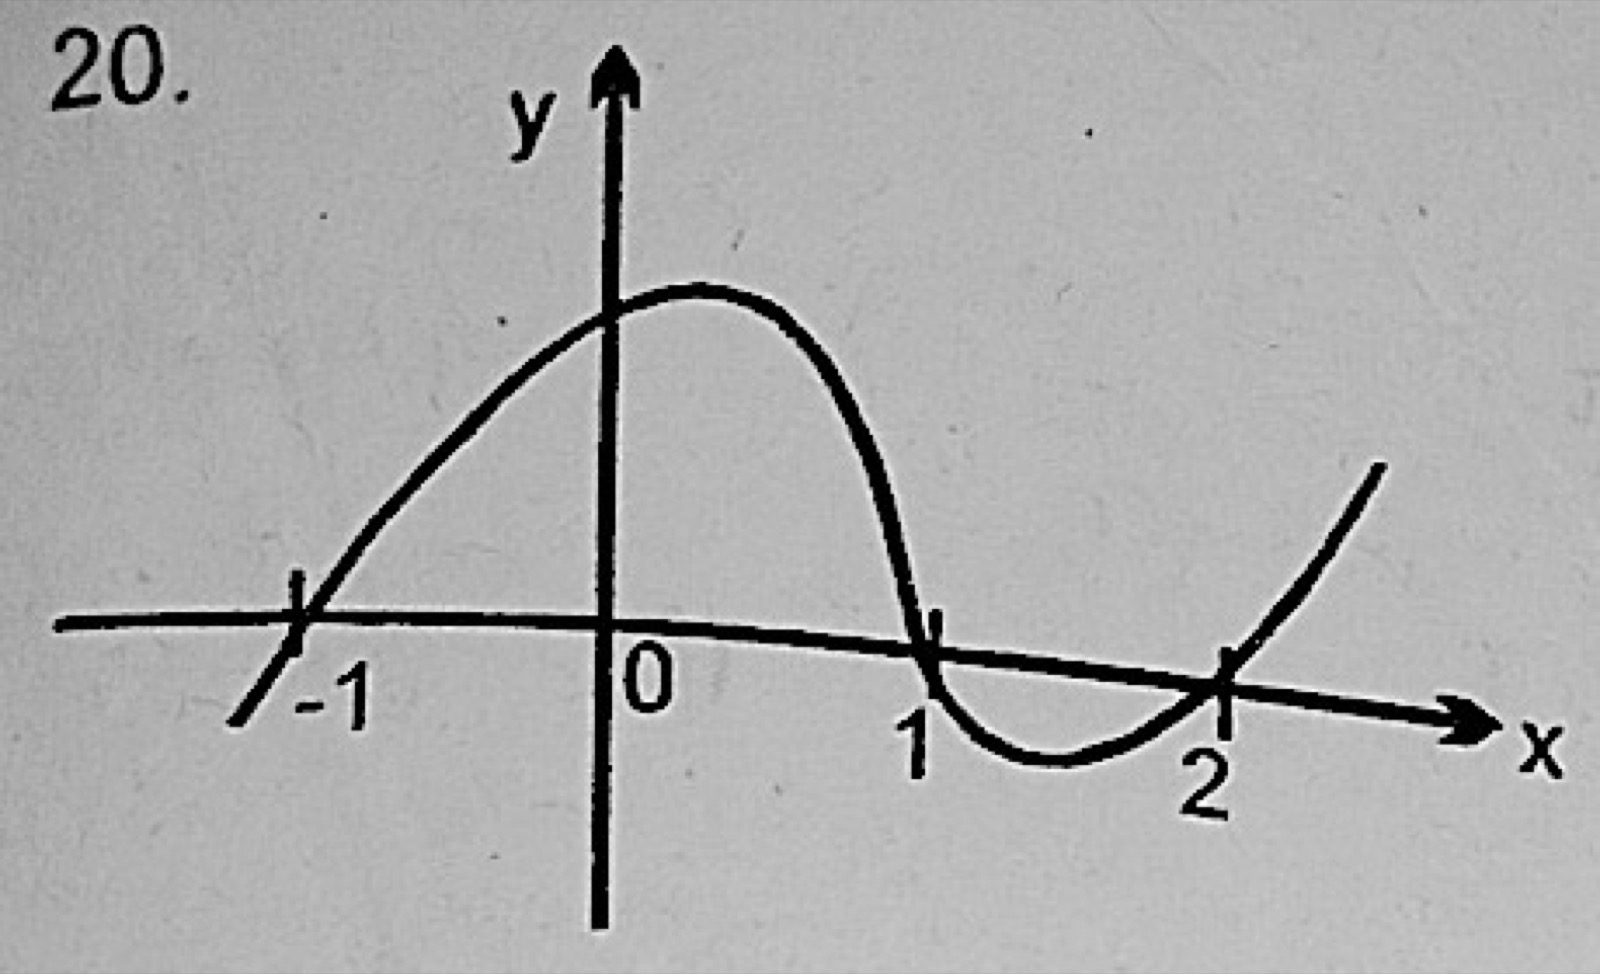
InequalitiesUse the graph of the curve y = f(x) above to solve the inequality f(x) ≥ 0.
- A.−1 ≤ x ≤ 1, x ≥ 2
- B.x ≥ −1, 1 ≤ x ≤ 2
- C.x ≤ −1, 1 ≤ x ≤ 2
- D.x ≤ 2, −1 ≤ x ≤ 1
Show the answer and explanation
Answer: A (−1 ≤ x ≤ 1, x ≥ 2)
Explanation
f(x) ≥ 0 where the curve is on or above the x-axis. It cuts the axis at −1, 1 and 2, is above it between −1 and 1, dips below between 1 and 2, then rises after 2. So −1 ≤ x ≤ 1 or x ≥ 2.