Question 48
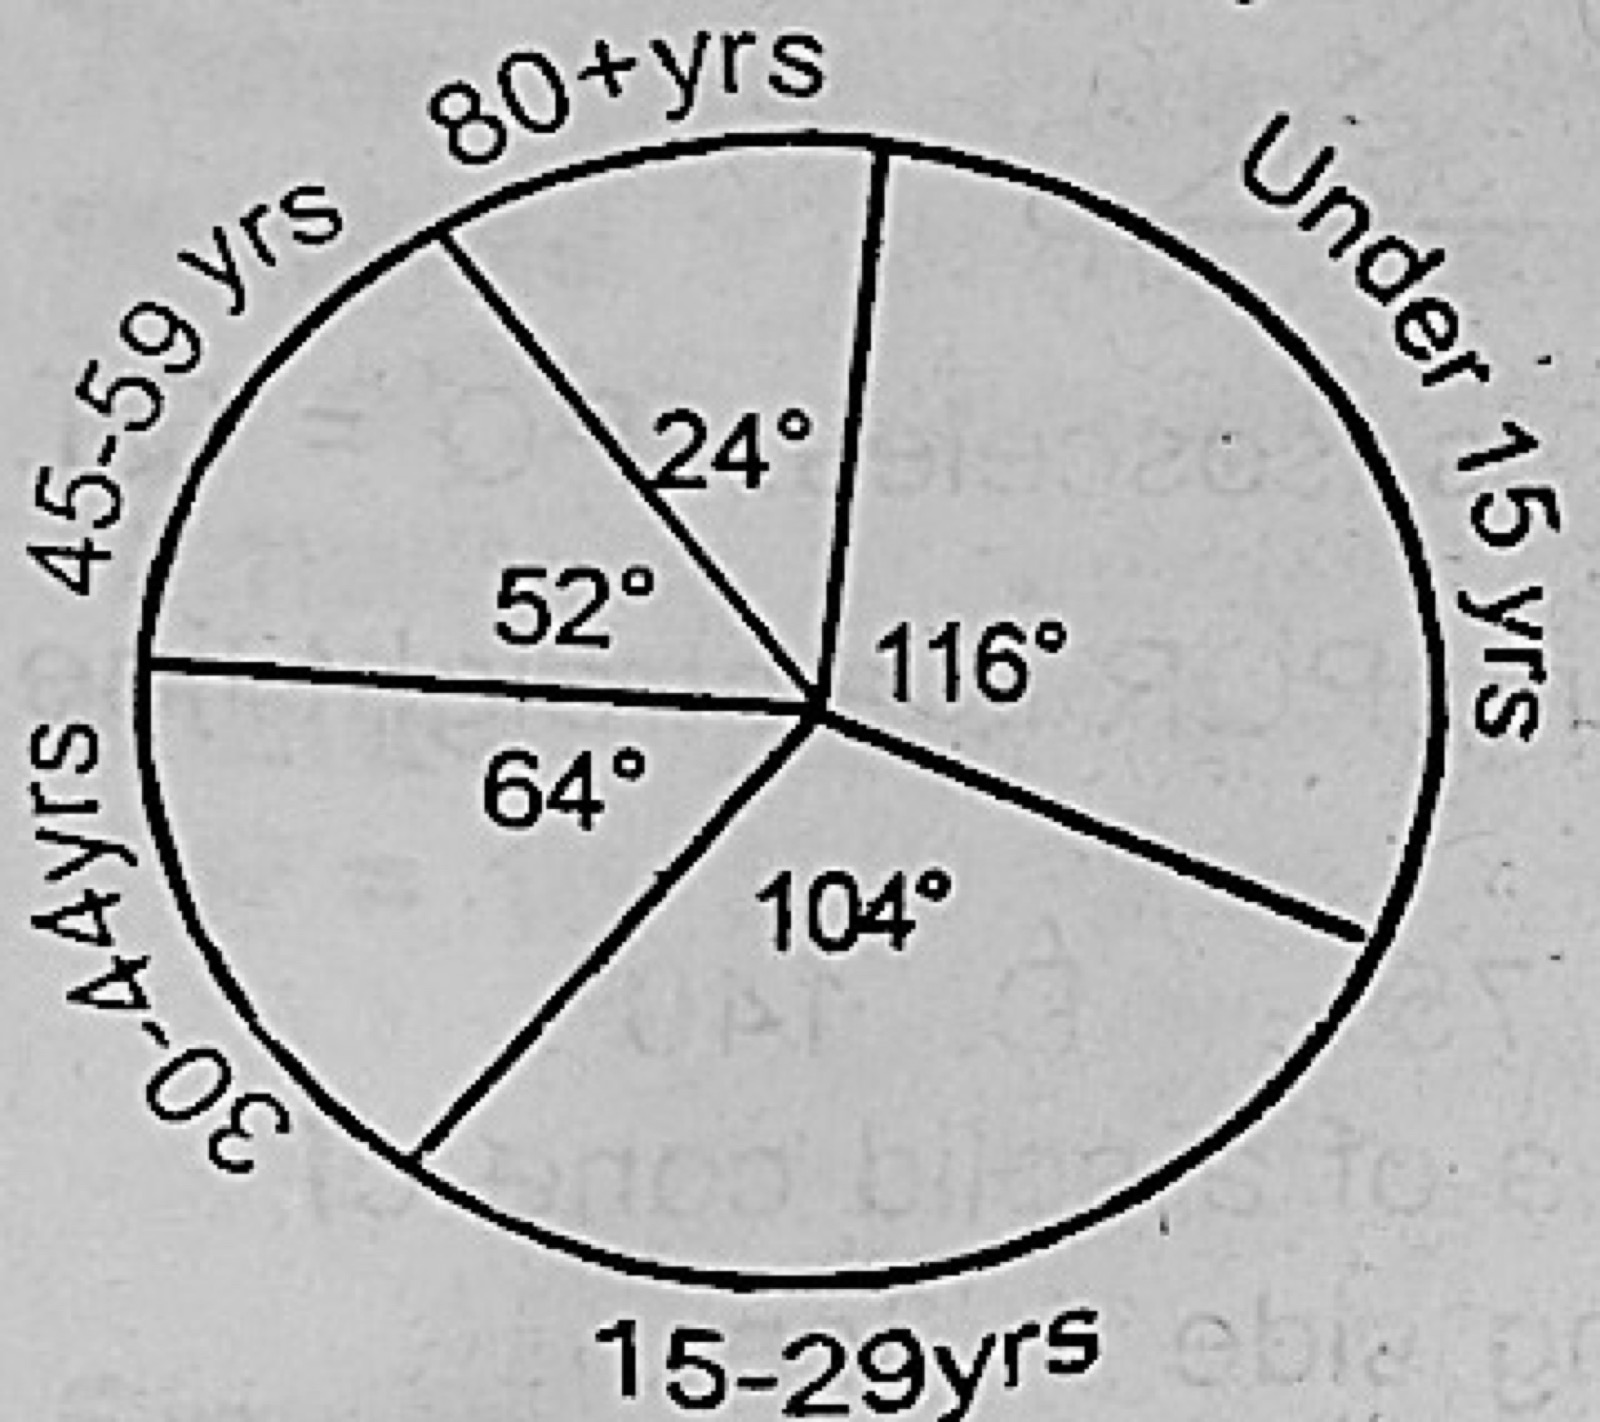
Measures of Central TendencyThe people in a city with a population of 0.9 million were grouped according to their ages. Use the diagram below to determine the number of people in the 15 − 29 years group.
- A.29 × 104
- B.26 × 104
- C.16 × 104
- D.13 × 104.
Show the answer and explanation
Answer: B (26 × 104)
Explanation
The 15–29 sector is 104°, so the number is 104/360 × 900 000 = 260 000 = 26 × 10⁴.