Question 18
Graphs of FunctionsWhich of the following equations represents the above graph?
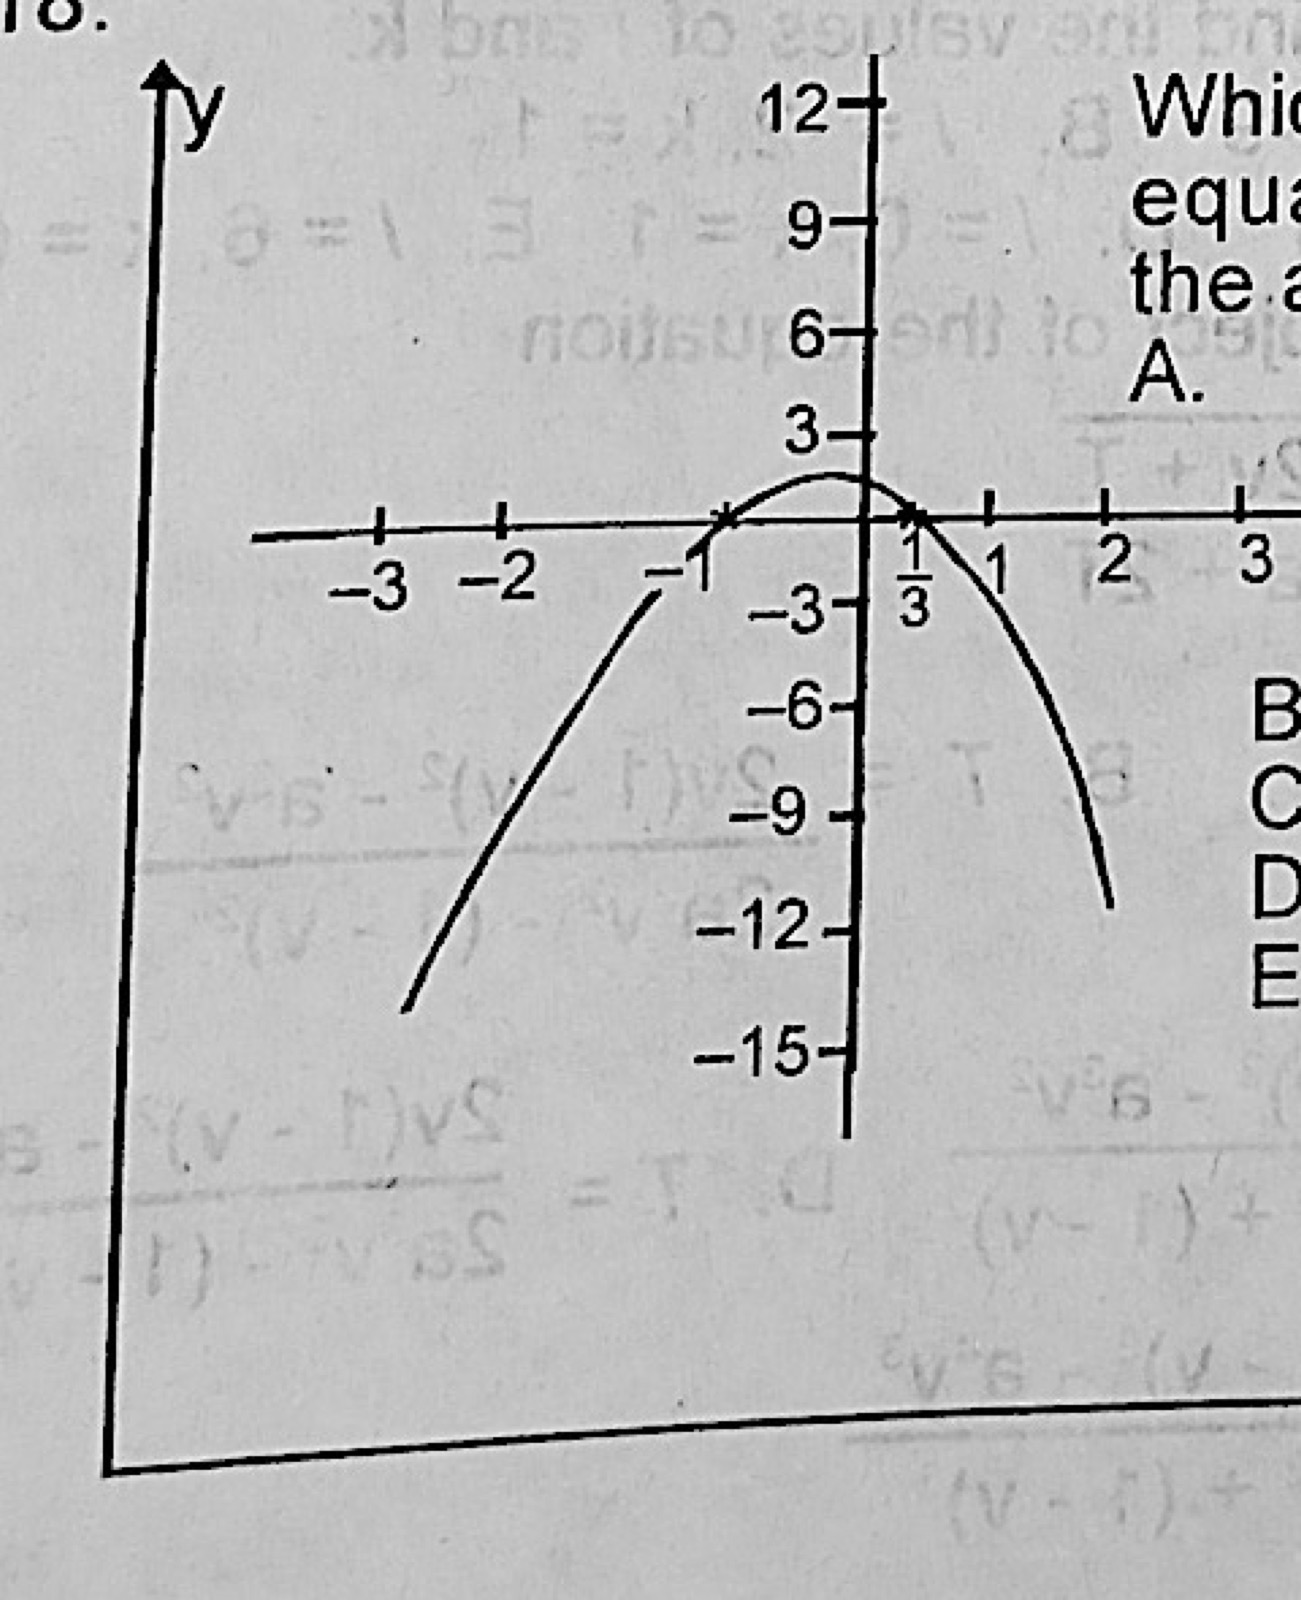
- A.y = 1 + 2x + 3x2
- B.y = 1 + 2x + 3x2
- C.y = 1 + 2x − 3x2
- D.y = 1 − 2x − 3x2
- E.y = 3x2 + 2x − 1.
Show the answer and explanation
Answer: D (y = 1 − 2x − 3x2)
Explanation
Roots −1 and ⅓ give the factors (x + 1)(3x − 1) = 3x² + 2x − 1. The curve is an upside-down parabola through (0, 1), so y = −(3x² + 2x − 1) = 1 − 2x − 3x².