Question 2
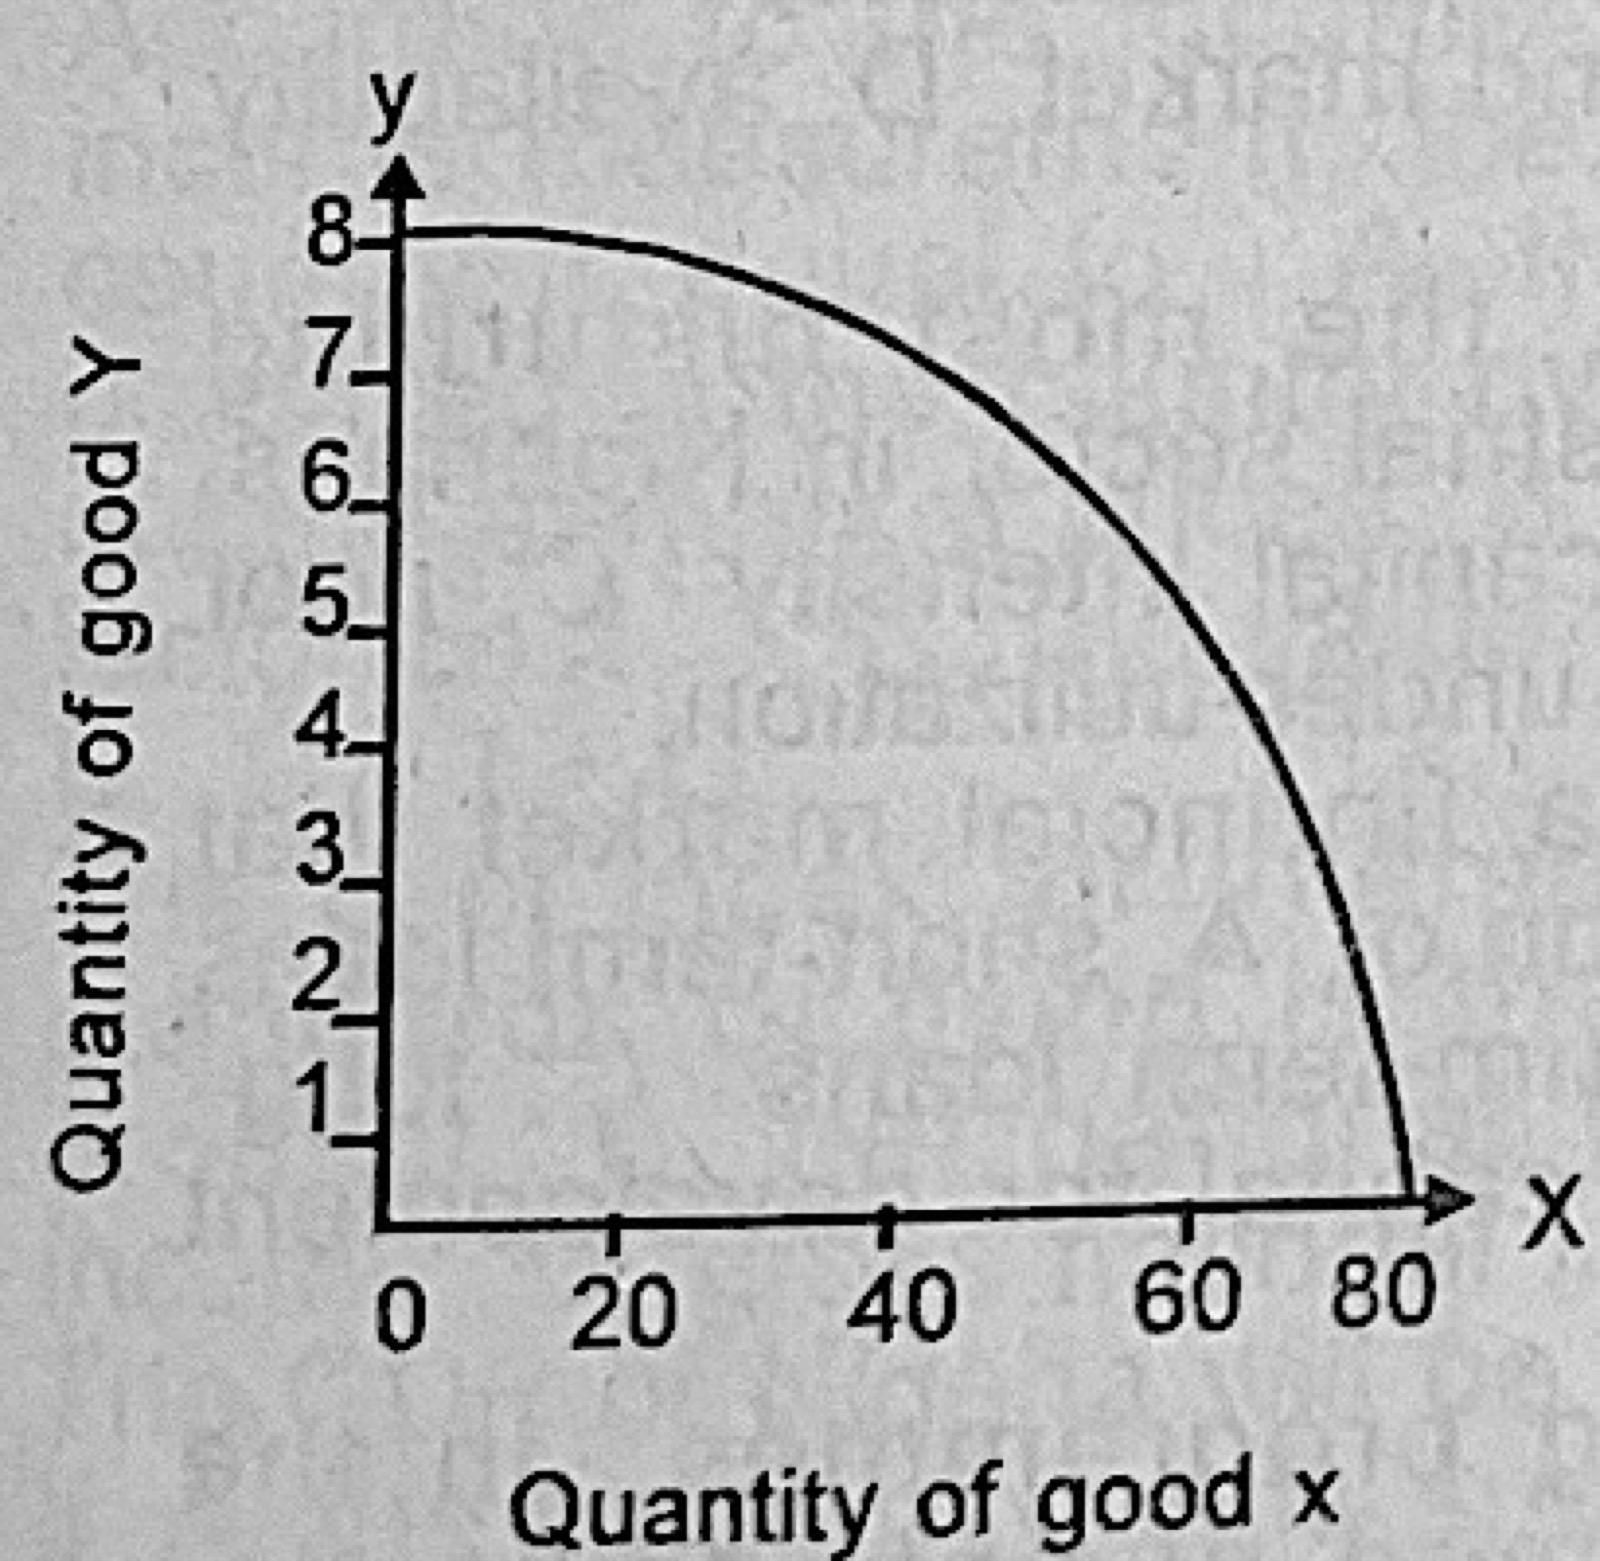
Basic ConceptsThe diagram (quantity of good Y against quantity of good X) showing the maximum possible combination of commodities X and Y produced in Nigeria is called the
- A.production indicator
- B.maximum production curve
- C.production possibility curve
- D.total output curve
Show the answer and explanation
Answer: C (production possibility curve)
Explanation
A curve showing the greatest combinations of two goods that can be produced with given resources is the production possibility curve.