Question 15
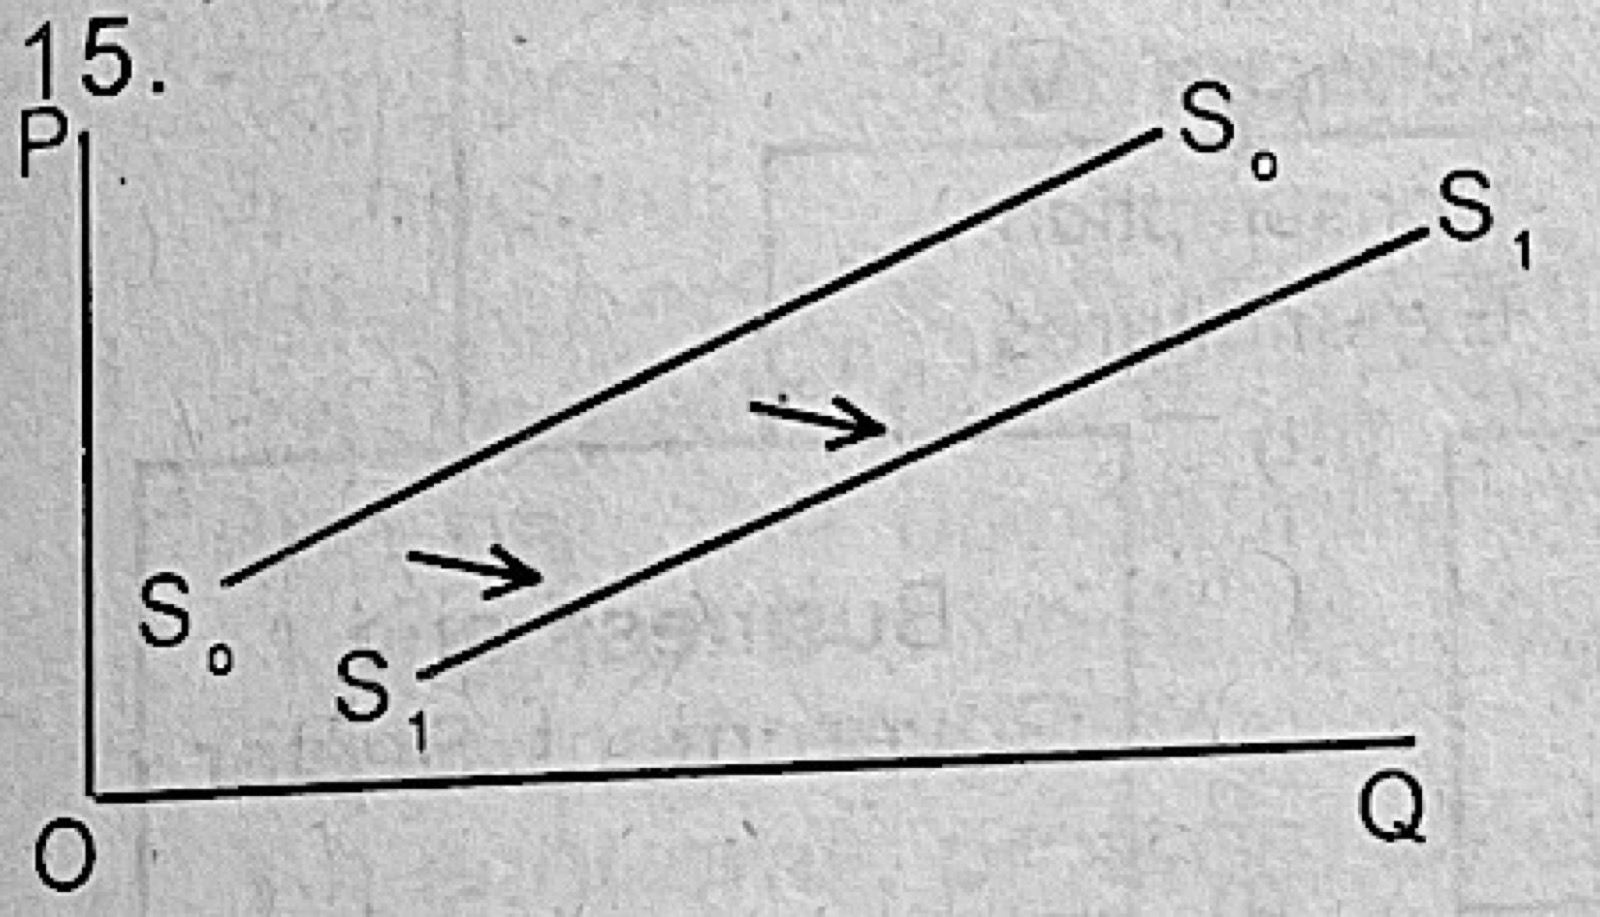
Theory of SupplyIn the above diagram, the supply curve S0S0 shifts to a new position S1S1 to indicate
- A.a drop in supply
- B.a rise in supply
- C.a supply-push inflation
- D.a stable supply curve
- E.an increase in quantity supplied.
Show the answer and explanation
Answer: B (a rise in supply)
Explanation
The whole supply curve moves to the right, so more is offered at every price: an increase in supply.