Question 35
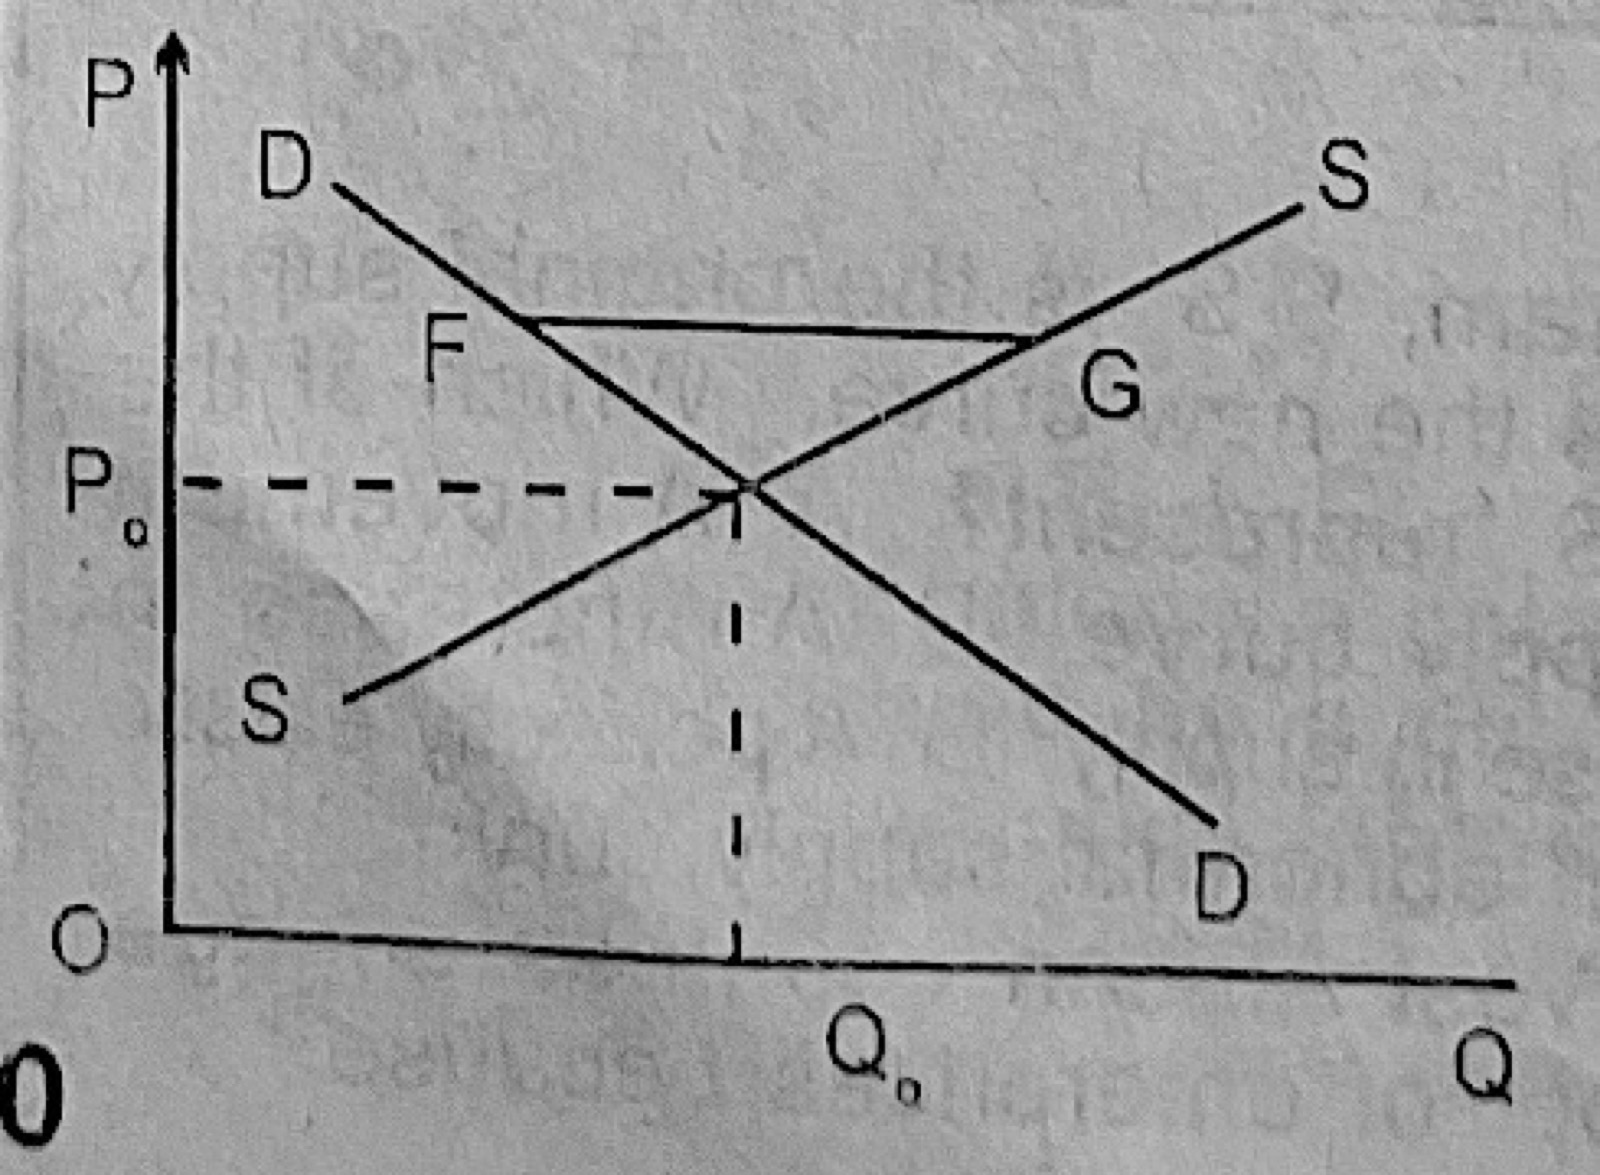
Price DeterminationIn the graph above, FG indicates
- A.excess demand
- B.excess supply
- C.equilibrium quantity supplied
- D.equilibrium quantity demanded
- E.equilibrium price.
Show the answer and explanation
Answer: B (excess supply)
Explanation
FG is drawn at a price above Po; there quantity supplied (G) is greater than quantity demanded (F), so FG is excess supply.