Question 10
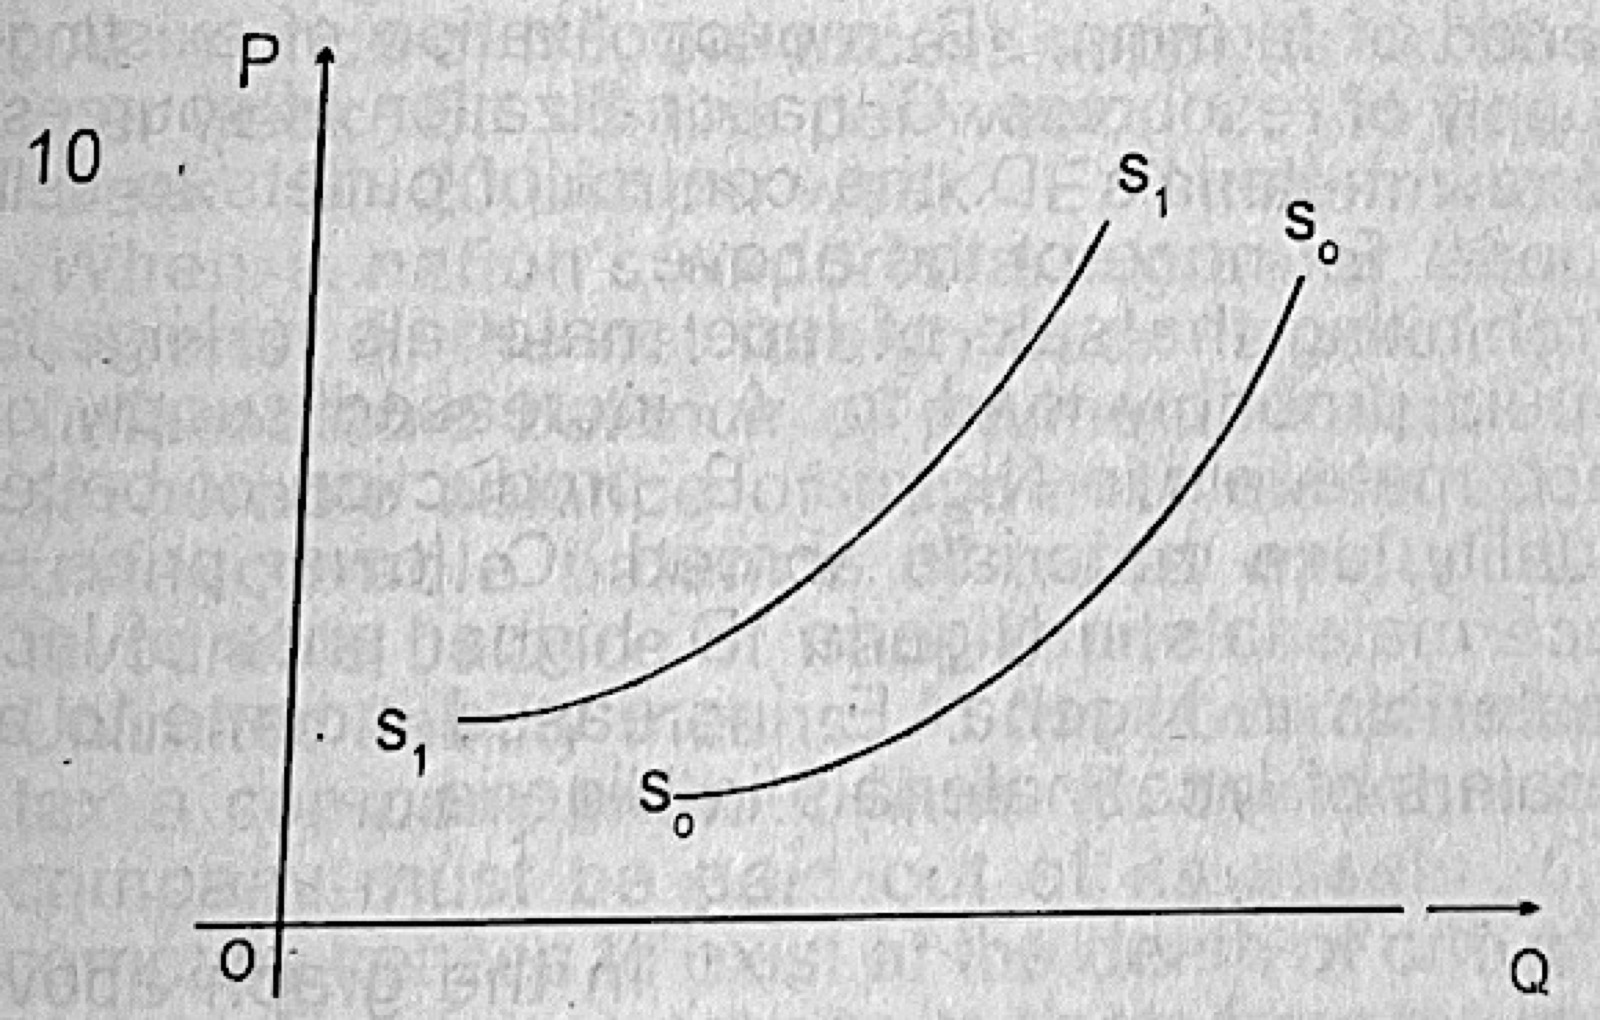
Theory of SupplyIn the above diagram, SoSo is the original supply curve while S1S1 is the new curve. Which of the following does S1S1 represent?
- A.A movement along a given supply curve
- B.An increase in supply
- C.A decrease in supply
- D.A perfectly elastic supply curve
- E.An abnormal supply curve.
Show the answer and explanation
Answer: C (A decrease in supply)
Explanation
S1S1 lies to the left of (above) SoSo, so less is supplied at each price: supply has decreased.