Question 30
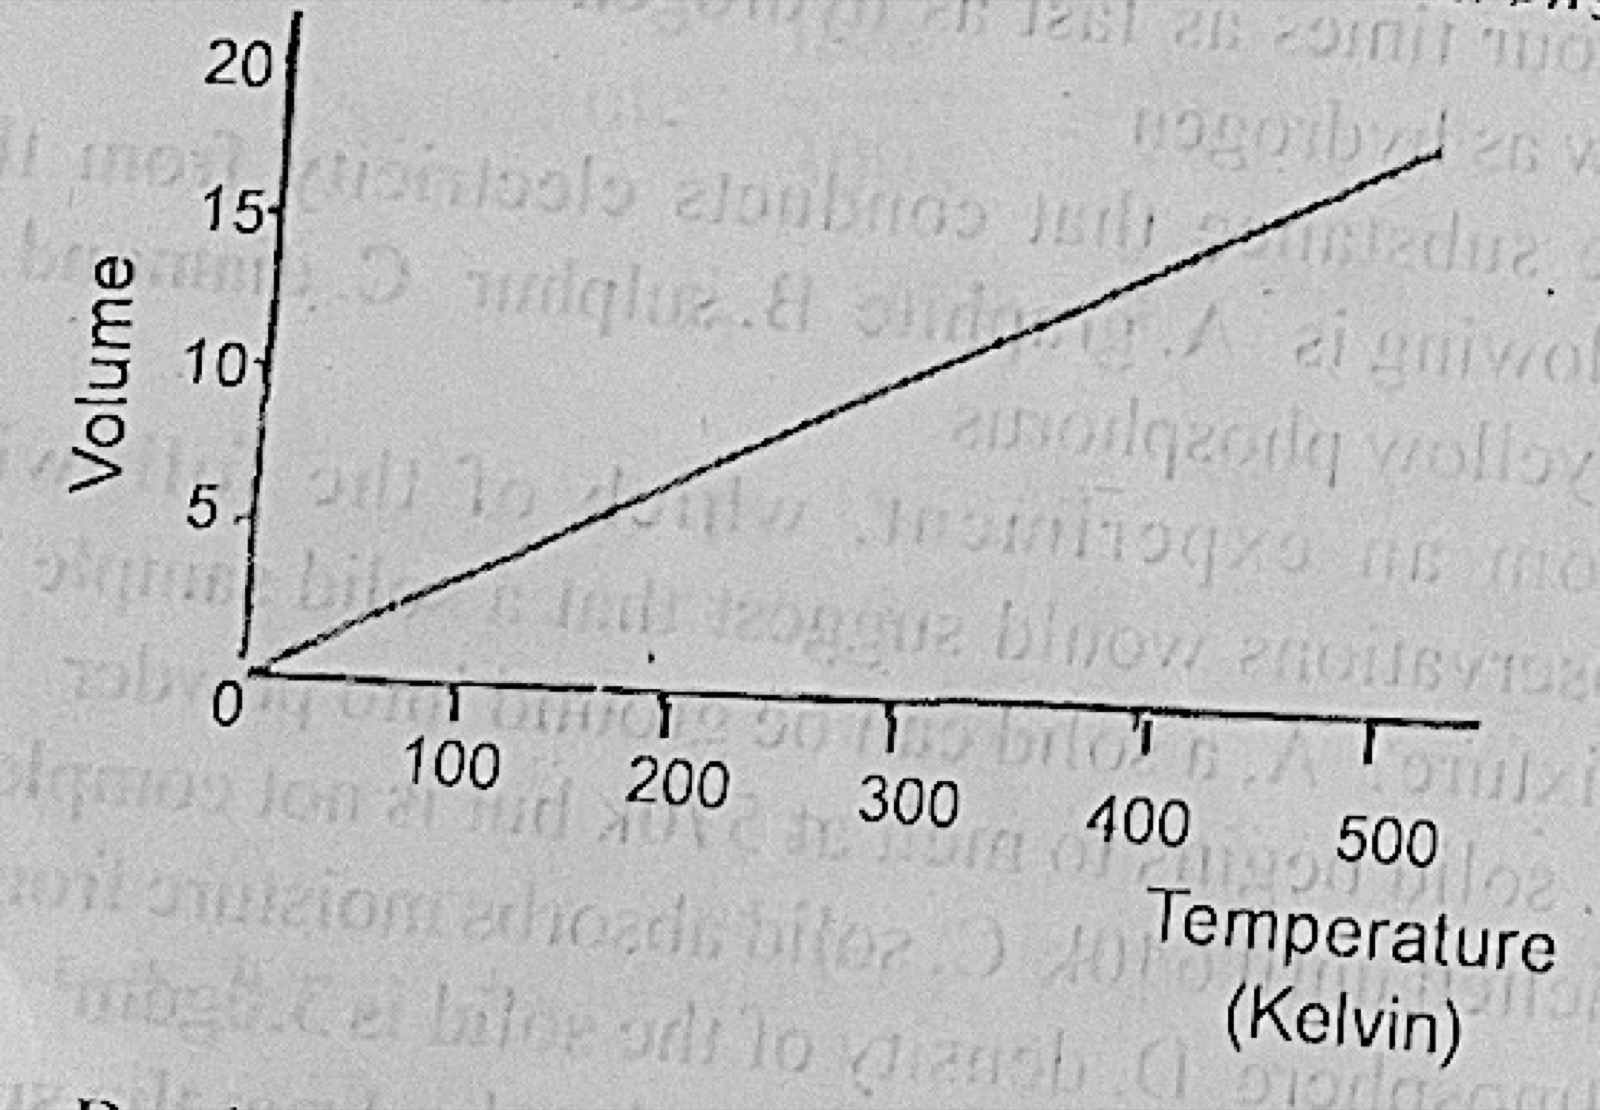
Gas LawsThe graph below illustrates which of the gas law?
- A.Boyle
- B.Graham
- C.Charles
- D.Gay-Lusac
Show the answer and explanation
Answer: C (Charles)
Explanation
The graph shows volume increasing in direct proportion to kelvin temperature (a straight line through the origin), which is Charles' law.