Question 27
Rates of ReactionIn the diagram above, which of the curves represents the evolution of oxygen with time in the equation 2KClO3(s) → 2KCl(s) + 3O2(g)?
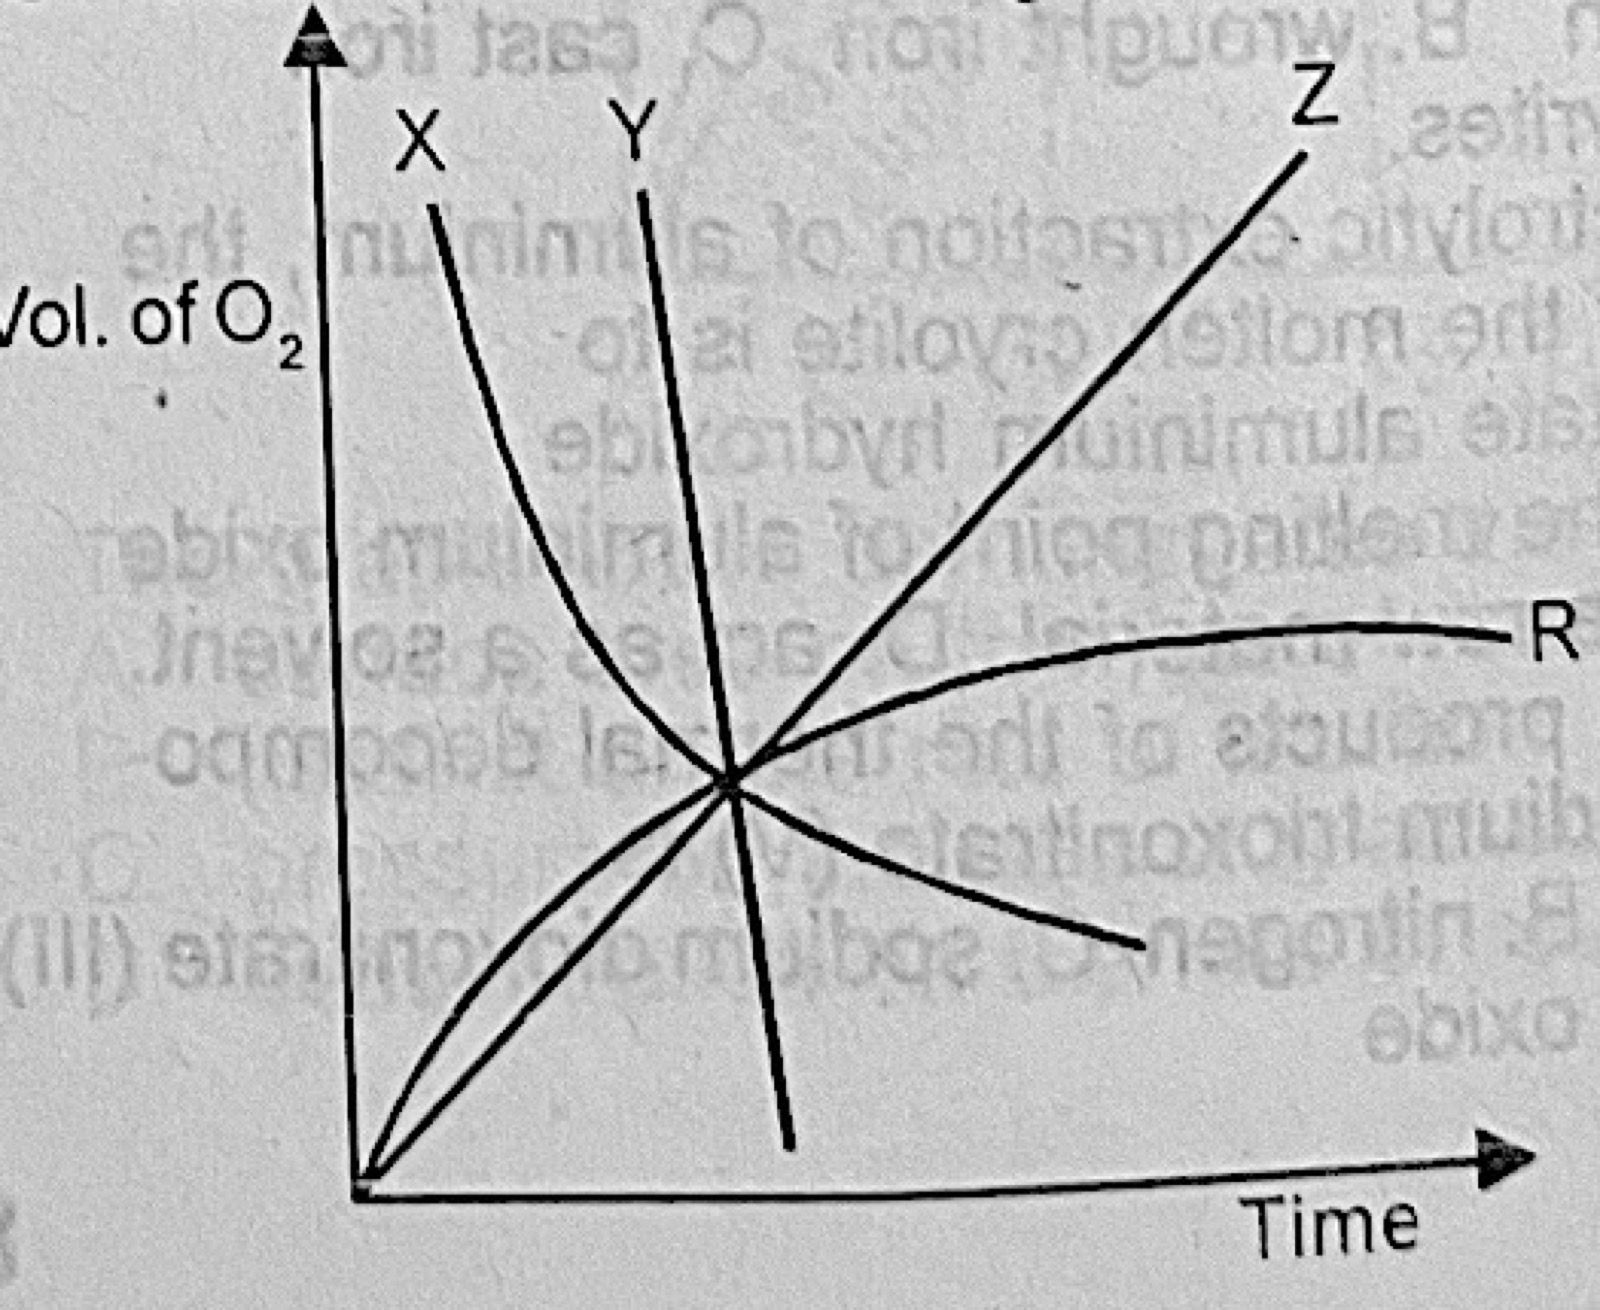
- A.X
- B.Y
- C.Z
- D.R
Show the answer and explanation
Answer: D (R)
Explanation
The volume of oxygen starts at zero, rises quickly, then levels off when all the KClO3 has decomposed, which is curve R.