Question 43
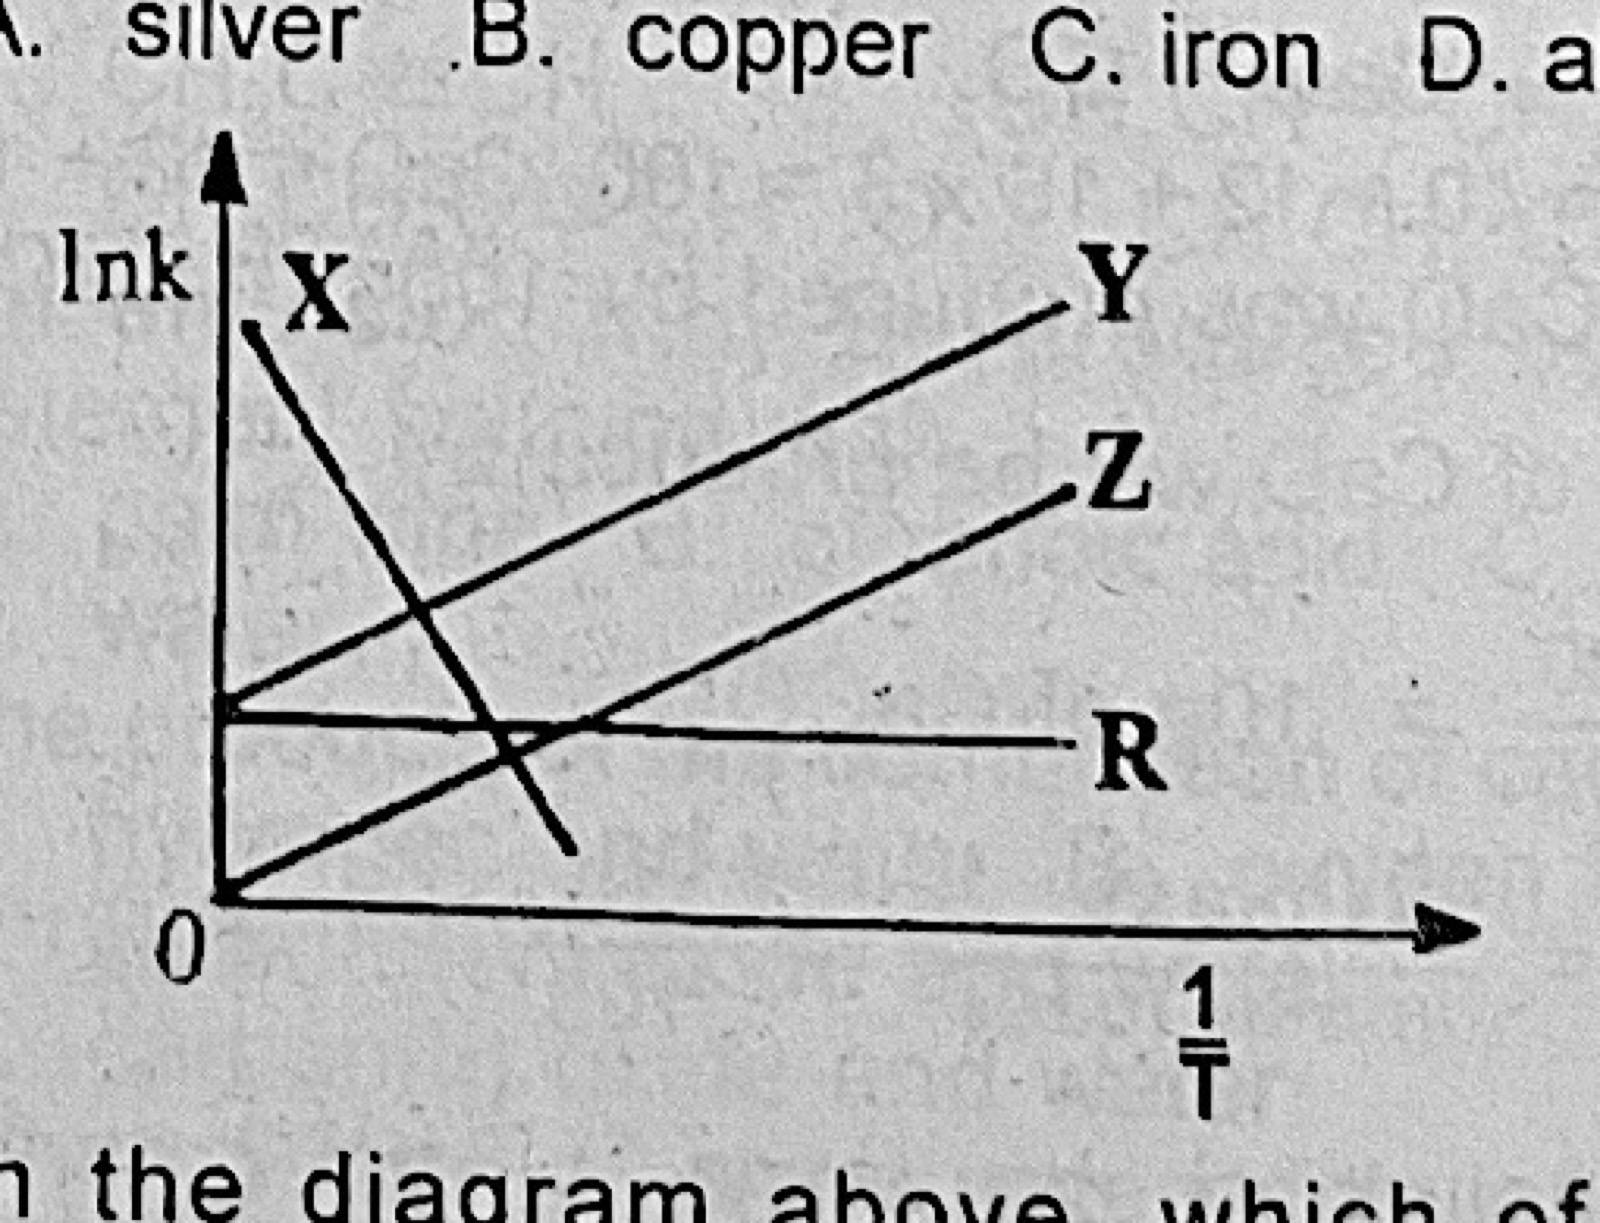
Rates of ReactionIn the diagram above (a graph of ln k against 1/T showing lines X, Y, Z and R), which of the curves illustrates Arrhenius' law?
- A.Y
- B.Z
- C.R
- D.X
Show the answer and explanation
Answer: D (X)
Explanation
Arrhenius: ln k = ln A − Ea/(RT). A plot of ln k against 1/T is a straight line with a negative slope, which is line X.