Question 22
Rates of Reaction2HCl(aq) + CaCO3(s) → CaCl2(s) + CO2(g) + H2O(l)
From the reaction above, which of the curves in the diagram represents the production of carbon (IV) oxide as dilute HCl is added?
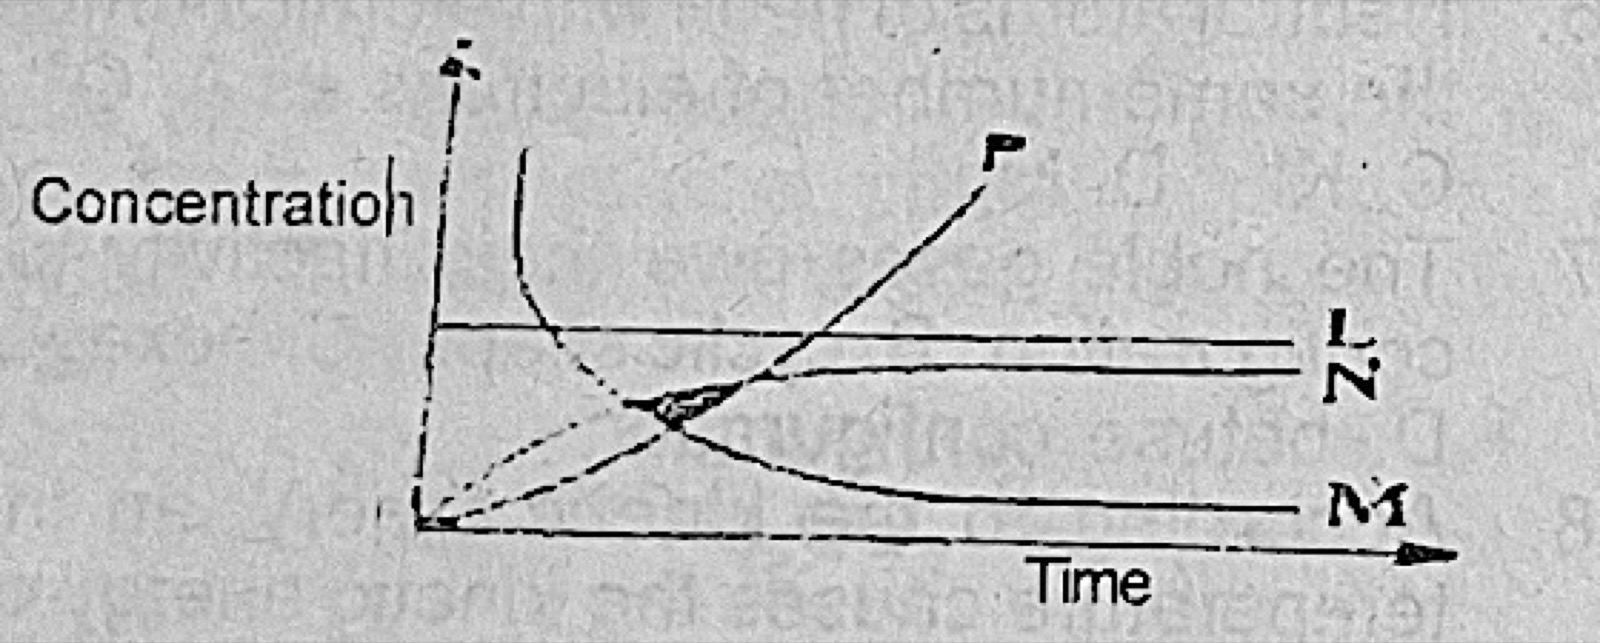
- A.L
- B.M
- C.N
- D.P
Show the answer and explanation
Answer: C (N)
Explanation
The amount of CO2 produced starts at zero, rises and then levels off when the reaction is complete; curve N has that shape. M falls, so it shows a reactant being used up.