Question 8
Rates of ReactionIn the diagram above, the curve that represents the production of oxygen gas from the decomposition of KClO3 in the presence of MnO2 catalyst is
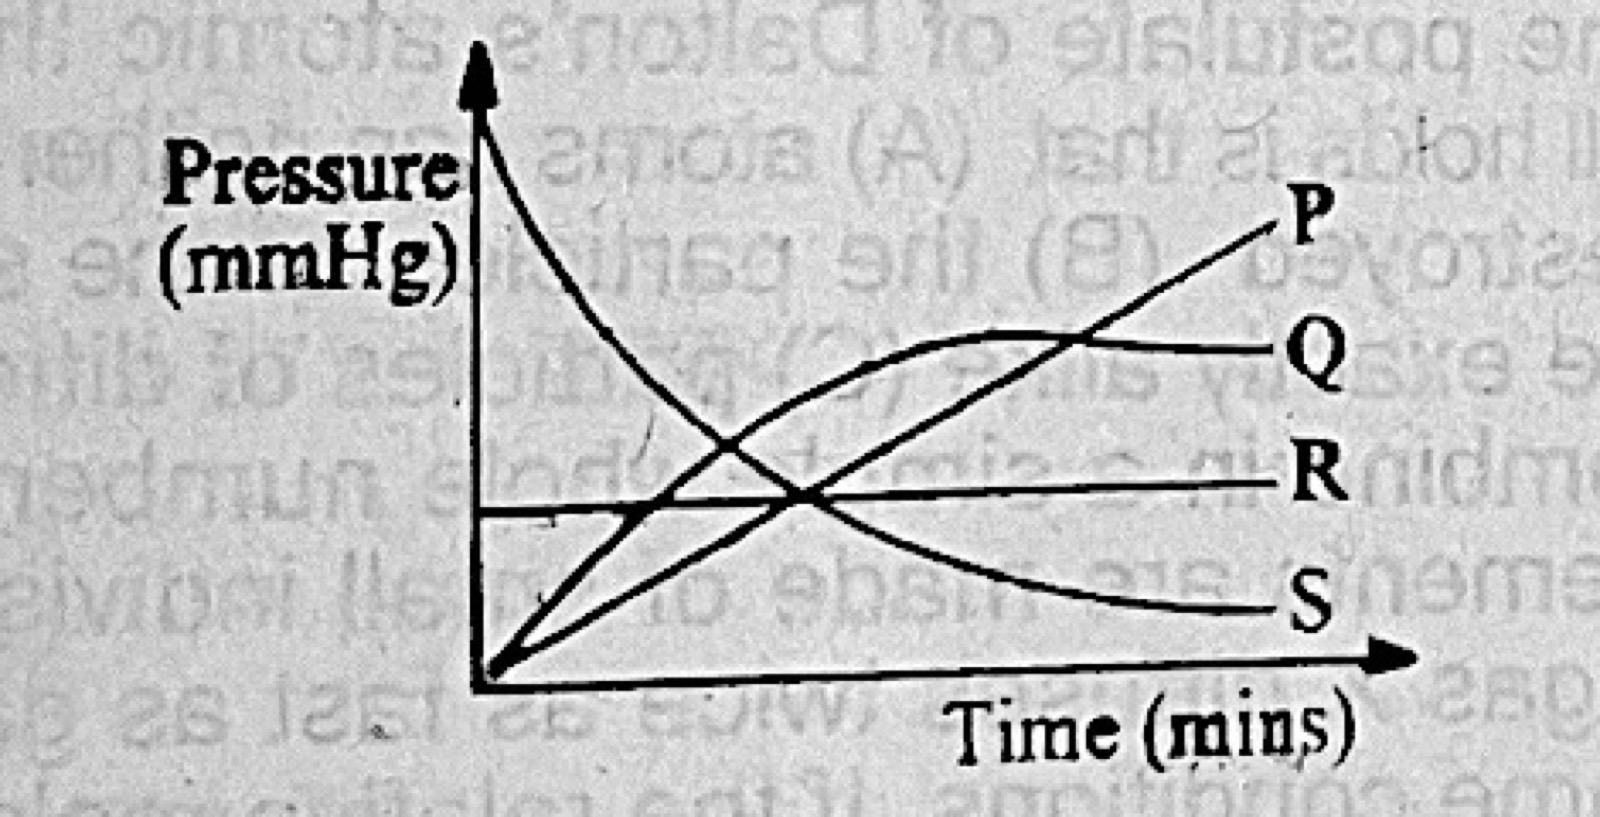
- A.R
- B.P
- C.S
- D.Q
Show the answer and explanation
Answer: D (Q)
Explanation
With MnO2 the KClO3 decomposes quickly at first, so the oxygen pressure rises fast. As the KClO3 runs out, the rate slows and the pressure levels off, which is the shape of curve Q.