Question 8
Gas LawsWhich of the curves W, X, Y and Z in the graph of PV/RT against P illustrates the behaviour of an ideal gas?
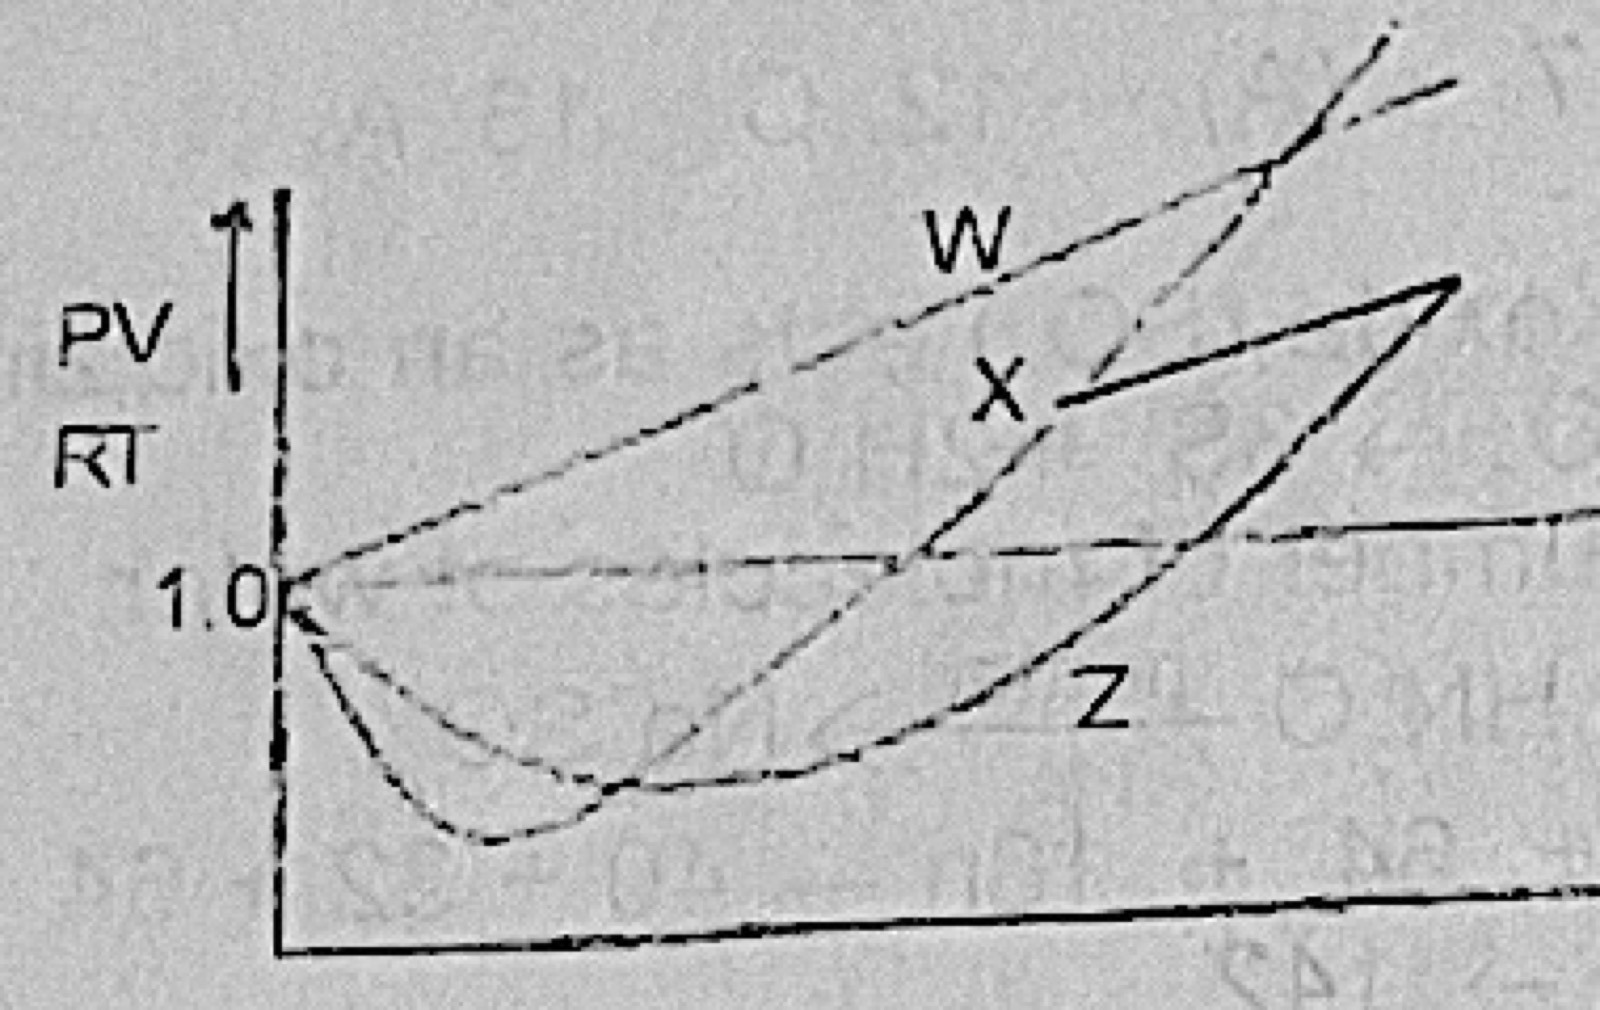
- A.W
- B.X
- C.Y
- D.Z
Show the answer and explanation
Answer: C (Y)
Explanation
For one mole of an ideal gas PV = RT, so PV/RT = 1 at every pressure. That is the horizontal line Y.